
Application Note
Assessment of drug effects on cardiomyocyte physiology using human iPSC-derived cardiac spheroids
- Acquire timelapse images and analyze cardiac spheroid beating patterns using high-content imaging
- Obtain simultaneous kinetic reading of calcium flux across all the wells using FLIPR Tetra system
- Measure the impact of different compounds on cardiac spheroid viability
Introduction
Cell models are becoming more complex in order to better mimic in vivo microenvironments and provide greater predictivity for compound efficacy and toxicity. There is an increasing interest in exploring the use of three-dimensional (3D) spheroids for modelling tissue biology and toxicity assessment. Development of quantitative assays in higher throughput using 3D cultures is an active area of investigation. In this study, we have developed methods for the formation of 3D spheroids derived from human induced pluripotent stem cells (iPSC). Using both high-content imaging (HCI) and fast kinetic fluorescence imaging (FLIPR), we have measured the impact of various compounds on the beating rate and pattern of cardiac spheroids as monitored by changes in intracellular calcium levels with calcium-sensitive dyes.
Formation of cardiac spheroids
Cryopreserved iCell Cardiomyocytes2 from Cellular Dynamics International (CDI) were used in the study. Cells were thawed and plated into ultra-low attachment (ULA) U-bottom 96-well plates at 20,000 cells/well or 10,000 cells/well in 384- well plates (Corning) and incubated for four days in maintenance media to form spheroid cultures. Cardiac spheroids were efficiently formed from iPSC-derived cardiomyocytes within 48 hours and started contracting spontaneously after 3-4 days in culture. These 3D cell models could then be used for cardiotoxicity assessment by staining them with a Ca2+ sensitive dye. Changes in the fluorescent intensities in response to intracellular Ca2+ flux were used as a surrogate marker for spheroid contraction. Significant alterations to the base-line beating pattern were observed in response to cardioactive and cardiotoxic compounds.
We describe here two methods for recording, quantifying, and characterizing the beat patterns of iPSC-derived cardiac spheroids: using high-content imaging (ImageXpress® Micro High- Content Imaging System) and fast kinetic fluorescence imaging (FLIPR Tetra® High- Throughput Cellular Screening System).
Acquisition and analysis of cardiac spheroids over time using high-content imaging
Imaging methods allow precise detection and visualization of cardiac spheroids and include acquisition of a time-lapse stack of images over a desired time period and frequency. The assay workflow used in this study is described in Figure 1. The ImageXpress Micro Confocal system obtained spheroid images using automatic time-lapse acquisition. The calcium flux patterns for entire spheroids were recorded and found to be synchronous with contraction (Figure 2). The recording frequency was set to 10-20 reads/second with a 5-10 second (or longer) reading period per well, at 20x or 10x magnification with FITC excitation and emission filters. Cells were kept under environmental control (37 °C, 5% CO2) or sealed. To allow higher frequency of readings, excitation times were 10 ms or less. This imaging method works efficiently for any spheroid size. We tested spheroids prepared from a range of 3,000-20,000 plated cells per well. We demonstrated that the beating frequency does not depend on spheroid size (data not shown). Cells were stained using Hoechst nuclear stain and FLIPR® Calcium 6 Dye (Molecular Devices, LLC), using standard recommended protocols.
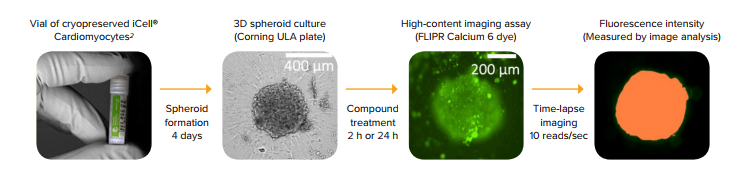
Figure 1. Schematic presentation of the assay workflow. iCell Cardiomyocytes2 were thawed and plated into U-bottom low attachment plates to form 3D cardiac spheroids. After 4 days in culture, the spheroids were treated with compounds for a desired length of time, stained with FLIPR Calcium 6 dye, and time-lapse images were acquired using the ImageXpress Micro Confocal system.
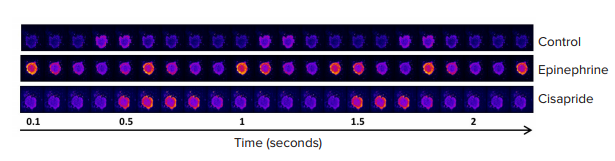
Figure 2. Time-lapse image series of contracting iPSC-derived cardiomyocyte spheroids loaded with a Ca2+ sensitive dye. Each image was taken at 100 millisecond intervals. Yellow/red (false color scale) indicates a high Ca2+ concentration and a state of contraction.
A MetaXpress Journal (available by request) was used to analyze the images. The journal automatically finds the spheroids, determines average fluorescence intensity at each time point, and saves intensity data for each time point in a plate format. A video clip can be saved within the imaging software by saving a time-lapse stack of spheroid images. The beating pattern can be reviewed by visualizing the intensity versus time in the Display Mode. Intensity data for each time lapse can also be exported into Excel format. Further analysis of the beating pattern can be done using SoftMax® Pro 7 Software (Figure 3), which imports intensity data, analyzes beating patterns, and defines primary parameters including the number of fluxes, beating frequency, amplitude, peak width, distance between peaks, peak rise, and decay times. These parameters can be used to determine dose-dependencies of observed compound effects, i.e., an increase or decrease of beating frequency,changes in amplitude, peak width, or decay times1,2. Concentration-dependent curves for the calcium flux frequency observed with several test compounds are shown in Figure 4. Table 1 shows IC50 values calculated for select compounds that were derived from using calcium flux frequency as the read-out.
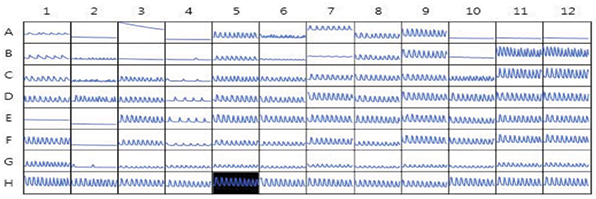
Figure 3. Kinetic fluorescent intensities of compound-treated cardiac spheroids. Image data was imported into the SoftMaxPro 7 Software for analysis of beating rates, amplitudes, peak width, and other read-outs. Shown here is a plate view of the time-lapse intensity plots.
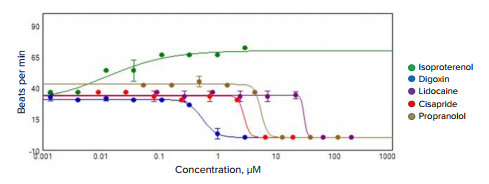
Figure 4. Graph of the dose-dependent changes in beating frequency caused by select compounds.
IC
50
, μM
Table 1. IC50 values for select compounds calculated from the concentration-dependent changes in calcium flux frequency.
Assessing spheroid viability using high-content imaging
This high-content imaging approach can also be used to define the impact of different compounds on cell viability. For example, we demonstrated that the cell viability of cardiac spheroids could be assessed after compound treatment by staining them with a combination of viability dyes: Calcein AM (live cell stain dependent upon esterase activity), Ethidium homodimer (cell-impermeable dead cell indicator), and Hoechst (cellpermeable nuclei stain that marks all the cells, both the live and the dead cell populations) which can be obtained in a ready-to-use EarlyTox™ Live/Dead Assay Kit. After a two hour incubation time with dye, the stained spheroids were imaged using the ImageXpress Micro Confocal system. A Z-stack of images was taken using 10x or 20x magnification, 10 μm apart, over a range of \~150 μm. Images were analyzed with MetaXpress software for total live and dead cells within the spheroid using 2D and 3D analysis modules. The methods for analyzing spheroids for viability markers were described previously3. Figure 5 shows example analysis for control and digoxin-treated spheroids. Multi-parametric assessment of compound effects can be done using the following measurements: cell number, spheroid size, and cell viability.
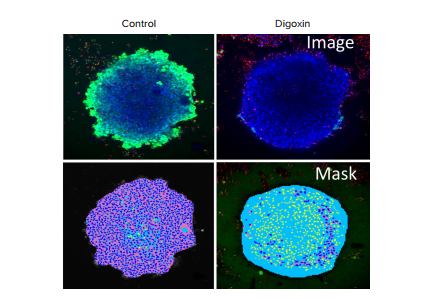
Figure 5. Imaging of cardiotoxicity using iPSC-derived cardiac spheroids. (Top row) control and digoxin-treated spheroids were stained with viability markers: Calcein AM (green), Hoechst (blue), and EthD-1 (red). (Bottom row) Image analysis masks showing the spheroids in blue, the cytoplasm of live cells in pink, and dead cells in yellow.
Optimize high-throughput screening using the FLIPR Tetra system to monitor Ca2+ Flux in beating cardiomyocyte spheroids
In contrast to the high-content imaging approach which involves time-lapse imaging of only one well at a time, the FLIPR Tetra system reads the fluorescent intensity from the entire plate at the same time, thereby enabling simultaneous kinetic reading of calcium flux across all the wells. The system is also compatible with automated liquid and plate handling. The ScreenWorks Peak Pro Software Module can be used to analyze and characterize the beating profiles, yielding multiparametric outputs such as beating rate, peak frequency and width, or waveform irregularities.
The calcium flux assay with iPSC-derived cardiac spheroids was optimized for highthroughput screening (HTS) in 96-well or 384-well plates using the FLIPR Tetra® system. The cardiac spheroids were formed in low-attachment U-bottom plates as described previously. We observed that the FLIPR Tetra system detected the spheroids more efficiently if the spheroid size was relatively large (300-500 μm, formed by 10,000-20,000 plated cells). FLIPR Calcium 6 dye was used to monitor changes in Ca2+ fluxes synchronous with cell beating. Reagent (2X concentration) was added to the plates and incubated for 2 hours at 37 °C, 5% CO2. Spheroids were exposed to compounds for either 2h or 24h. A pre-drug read was acquired at \~8 frames per second using the FLIPR Tetra system, with 485 nm excitation and 530 nm emission settings. Additional reads were acquired after different compound incubation times to understand the temporal relationship between varying compound exposure times. Recording of the calcium flux was typically carried out for \~2 min to obtain a robust data set.
To illustrate the applicability of the FLIPR Tetra fast kinetic fluorescence imaging approach to assay advanced 3D cell models, we subjected the cardiac spheroids to several known cardioactive and cardiotoxic compounds, including α- and ß-blockers (isoproterenol, propranolol, and verapamil), known compounds that affect hERG channels (haloperidol), and ion channel blockers (lidocaine). In addition, several environmental toxins were tested, including pesticides (rotenone), flame retardants (triphenyl phosphate), and other toxic chemicals. The calcium flux (beating) patterns for control and test compoundtreated cardiac spheroids are represented in Figure 6A. Not surprisingly, compound treatments dramatically modified the beating patterns in a dose-dependent manner (Figure 6B). However, further comparison of the IC50 values determined from the 3D spheroid cultures with those obtained with cells plated in traditional 2D formats demonstrated significant differences in the assay sensitivity, with 3D cultures showing a general right-shifting trend (i.e., higher IC50 values) in their responses (Table 2). Whether or not the reduced cardiac spheroid sensitivity towards these test compounds is actually more predictive than traditional 2D culture formats will require additional follow-up. Nevertheless, these results indicate the potential utility of combining miniaturized iPSC-derived cardiac 3D cell models with fast kinetic fluorescence imaging to support high-throughput cardiac toxicity screening.
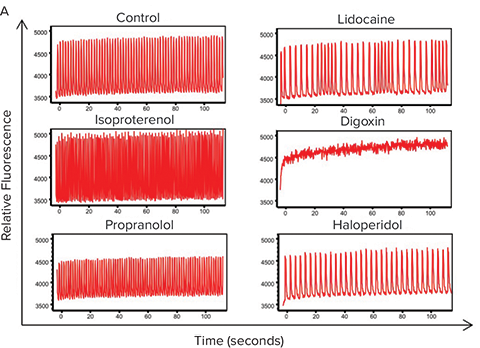
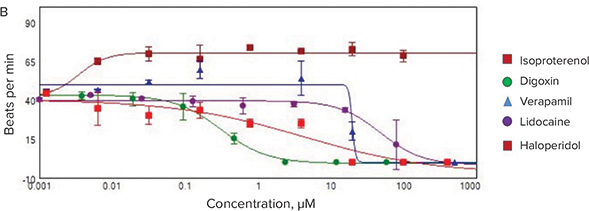
Figure 6. Fast kinetic fluorescence analysis of cardiac spheroid responses to test compounds. (A) Comparison of the Ca2+ flux profiles from cardiac spheroids treated with select compounds and measured using a FLIPR Tetra instrument. Frequencies, amplitude, peak width and other parameters are automatically calculated by the ScreenWorks PeakPro Software Module. (B) Dose-response plots of the test compound effects on cardiac spheroid beat rates.
3D IC
50
(μM)
2D IC
50
(μM)
Table 2. Comparison of the calcium flux IC50 values calculated from test compound-treated iPSC-derived cardiomyocytes in two different formats, 3D spheroids versus traditional 2D cultures.
Summary
We demonstrated that in addition to spheroid viability assays, measurement of calcium flux in beating cardiac spheroids using the FLIPR Tetra system and timelapse high-content imaging assays are suitable for HTS. Both systems show utility for evaluation of potential cardiotoxicity using in vitro 3D cell models derived from human iPSC-derived cardiomyocytes.
References
- Sirenko, O., C. Crittenden, N. Callamaras, J. Hesley, Y.-W. Chen, C. Funes, I. Rusyn, B. Anson, and E. F. Cromwell. “Multiparameter In Vitro Assessment of Compound Effects on Cardiomyocyte Physiology Using IPSC Cells.” Journal of Biomolecular Screening 18.1 (2012): 39-53. Web.
- Sirenko, Oksana, Evan F. Cromwell, Carole Crittenden, Jessica A. Wignall, Fred A. Wright, and Ivan Rusyn. “Assessment of Beating Parameters in Human Induced Pluripotent Stem Cells Enables Quantitative in Vitro Screening for Cardiotoxicity.”Toxicology and Applied Pharmacology 273.3 (2013): 500-07. Web.
- Sirenko, Oksana, Michael K. Hancock, Jayne Hesley, Dihui Hong, Avrum Cohen, Jason Gentry, Coby B. Carlson, and David A. Mann. “Phenotypic Characterization of Toxic Compound Effects on Liver Spheroids Derived from IPSC Using Confocal Imaging and Three-Dimensional Image Analysis.” ASSAY and Drug Development Technologies 14.7 (2016): 381-94. Web.
Learn more about the ImageXpress Micro Confocal High-Content Imaging System >>
Explore all the capabilities of the FLIPR Tetra High-Throughput Cellular Screening System >>