
Application Note
HumSilencer eliminates electrical hum without causing signal distortion
- No distortion of acquired signals
- No elimination of 50/60 Hz biological signals
- Can distinguish between 50/60 Hz noise and 50/60 Hz biological signals
Introduction
Electrical hum is the most common source of background noise in electrophysiology experiments. It is caused by the alternating current (AC) of the electrical mains, delivered via power outlets. This background noise interferes with biological signals of interest. We have previously demonstrated that the HumSilencer™ Adaptive Noise Cancellation feature of our Axon™ Digidata® 1550 Series digitizers successfully eliminate 50 Hz or 60 Hz line-frequency hum and its associated high frequency harmonics in a variety of electrophysiology applications1 . Some of our customers still question whether the underlying HumSilencer algorithm either (a) distorts the acquired biological signal in any way, (b) removes 50/60 Hz frequencies that are part of the biological signal, and (c) is able to distinguish between 50/60 Hz frequencies that are caused by background interference, and 50/60 Hz frequencies within the biological signal, and only removes the former. These questions will be addressed in this application note.
Experimental design
To investigate whether the HumSilencer feature distorts acquired biological signals, we examined its effect on end-plate potentials and action potentials recorded from mouse flexor digitorum brevis or interosseous muscle fibers. Two-electrode voltage-clamp recordings were made using the Axon™ Axoclamp™ 900A Microelectrode Amplifier. End-plate potentials and action potentials were evoked by injecting depolarizing current pulses to the muscle cell. The acquired signal was sent into two analog input channels of the Digidata 1550A, one of which was digitized using the HumSilencer feature. This enabled comparison of raw data to data where the HumSilencer feature was used. Acquired and digitized signals were then recorded using the Episodic Stimulation mode and analyzed using pCLAMP™ software version 10.5. In some experimental conditions, an external noise generator was placed near the headstage to introduce exogenous line-frequency noise. Evoked end-plate potentials and action potentials were analyzed using the Event Detection program in the pCLAMP software.
HumSilencer does not distort current-induced action potentials
The injection of a depolarizing current pulse (100 nA, 100 ms) (Figure 1, bottom panel) evoked a train of action potentials (Figure 1, middle panel). With HumSilencer enabled, no distortion of the evoked action potential train, in terms of frequency and amplitude of spikes, was observed (Figure 1, top panel). We further measured the peak amplitude and time of peak amplitude of each spike of the action potential train. The peak amplitude was measured from the peak of the spike relative to the baseline – the resting membrane potential. The time of peak amplitude was measured from the time of occurrence of the spike relative to the beginning of the trace. There was no significant difference in peak amplitude and time of peak amplitude of each spike of the train of action potentials obtained with and without HumSilencer enabled, as shown in Table 1. Together, these data suggests that HumSilencer does not distort biological signals.

Figure 1. HumSilencer (HS) does not distort current-induced action potentials. A series of action potentials was evoked by injecting a depolarizing current pulse into the recorded muscle cell (HumSilencer enabled data in top panel, raw data in middle panel). The injected current pulse is 100 nA magnitude and 100 ms duration (bottom panel). The resting membrane potential of the muscle cell was -71 mV. Data courtesy of Andrew Voss, PhD., Wright State University.
1
st
Spike
2
nd
Spike
3
rd
Spike
4
th
Spike
5
th
Spike
6
th
Spike
7
th
Spike
8
th
Spike
9
th
Spike
10
th
Spike
Table 1: Comparison of the peak amplitude and time of peak amplitude of each spike from the raw data trace vs spikes from the HumSilencer (HS) enabled trace shown in Figure 1.
HumSilencer does not eliminate 60 Hz biological signals
To further investigate the elimination of 60 Hz signals/interference by the HumSilencer algorithm, 60 Hz end-plate potentials and 60 Hz action potentials were evoked by injecting a 60 Hz series of depolarizing current pulses into the recorded muscle cell. The middle panel of Figure 2 shows that 60 Hz end-plate potentials were evoked by injecting a train of depolarizing current pulses (300 nA, 0.5 ms) of 60 Hz frequency (Figure 2, bottom panel). With the HumSilencer enabled, the frequency and amplitude of the evoked 60 Hz endplate potentials did not change (Figure 2, top panel). More depolarizing current (500 nA, 0.5 ms) (Figure 3, bottom panel) was then injected into the cell to elicit a train of 60 Hz action potentials (Figure 3, middle panel). No change in the evoked 60 Hz action potential was observed after HumSilencer was enabled (Figure 3, top panel). We measured the peak amplitude, time of peak amplitude, half-width, rise tau, decay tau, maximal rise slope, maximal decay slope, 10%-90% rise time, 10%-90% rise slope, 90%-10% decay time and 90%- 10% decay slope of each event. There was no significant difference in any of the measured parameters for the evoked end-plate potentials (Table 2) and action potentials (Table 3) obtained with and without HumSilencer enabled.
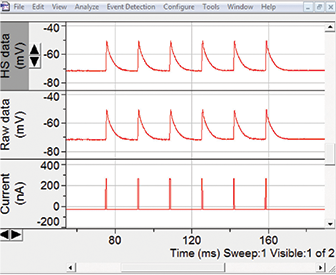
Figure 2: HumSilencer (HS) does not eliminate 60 Hz end-plate potentials. A train of 60 Hz end-plate potentials was induced by injecting a series of 60 Hz depolarizing current pulses into the recorded cell (HumSilencer enabled data in top panel, raw data in middle panel). The injected current pulse was 300 nA magnitude and 0.5 ms duration (bottom panel). The resting membrane potential of the muscle cell was -71 mV. Data courtesy of Andrew Voss, PhD., Wright State University
1
st
Spike
2
nd
Spike
3
rd
Spike
4
th
Spike
5
th
Spike
6
th
Spike
Table 2: Comparison of the characteristics of each spike from the raw data trace vs. spikes from the HumSilencer (HS) enabled trace shown in Figure 2.
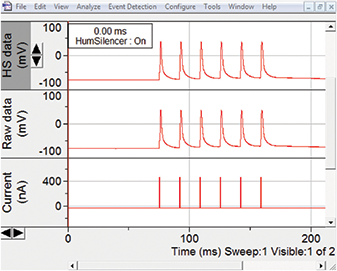
Figure 3: HumSilencer (HS) does not eliminate 60 Hz action potentials. A train of 60 Hz action potentials was evoked by injecting a series of 60 Hz depolarizing current pulses into the recorded cell, HumSilencer enabled data (top panel), raw data (middle panel). The injected current pulse was 500 nA magnitude and 0.5 ms duration (bottom panel). The resting membrane potential of the muscle cell was -71 mV. HumSilencer was enabled in the top panel during the entire recording. Data courtesy of Andrew Voss, PhD., Wright State University.
1
st
Spike
2
nd
Spike
3
rd
Spike
4
th
Spike
5
th
Spike
6
th
Spike
Table 3: Comparison of the characteristics of each spike from the raw data trace vs. spikes from the HumSilencer (HS) enabled trace shown in Figure 3.
HumSilencer eliminates 60 Hz interference but not 60 Hz biological signals
To test whether the HumSilencer system is able to eliminate 60 Hz line-frequency noise without eliminating 60 Hz signals, exogenous 60 Hz interference was introduced to the recording system by placing a noise generator near the headstage. The introduced 60 Hz interference was picked up by the headstage and acquired along with the 60 Hz end-plate potentials (Figure 4, middle panel) evoked by injecting a 60 Hz series of current pulses (50 nA, 0.5 ms) (Figure 4, bottom panel). When the HumSilencer was enabled, the 60 Hz interference, but not the 60 Hz biological signals, was eliminated (Figure 4, top panel). We measured the time of peak amplitude of each spike of evoked end-plate potentials and found no significant difference between those obtained with and without HumSilencer enabled, as shown in Table 4.
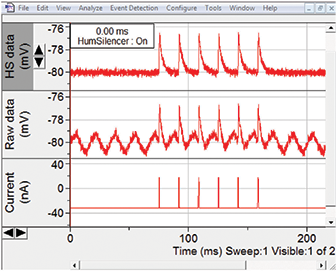
Figure 4: HumSilencer (HS) eliminates 60 Hz line-frequency noises but not 60 Hz end-plate potentials. A train of 60 Hz end-plate potentials was evoked by injecting a series of 60 Hz depolarizing current pulses (50 nA, 0.5 ms) into the recorded cell (bottom panel). 60 Hz end-plate potentials were purposely contaminated with exogenous 60 Hz line-frequency interference by placing an external noise generator near to the headstage (middle panel). Introduced 60 Hz interference, but not 60 Hz signals, was eliminated by HumSilencer system (top panel). The resting membrane potential of the muscle cell was -80 mV. HumSilencer was enabled in the top panel during the entire recording. Data courtesy of Andrew Voss, PhD., Wright State University.
1
st
Spike
2
nd
Spike
3
rd
Spike
4
th
Spike
5
th
Spike
6
th
Spike
Table 4: Comparison of time of peak amplitude of each spike from the raw data trace vs. spikes from the HumSilencer (HS) enabled trace shown in Figure 4.
Conclusion
In this application note, we have answered many of the questions and concerns of using HumSilencer to remove linefrequency interference without distorting the biological signals during data acquisition. Our results indicate that the HumSilencer itself does not distort acquired biological signals in any way. More importantly, it eliminates 60 Hz line-frequency interference but not 60 Hz biological signals. These results confirm that the HumSilencer feature is not a filter and does not have a filtering effect on acquired signals; nor does the Humsilencer system cause signal distortion, such as frequency change, amplitude attenuation, phase shift, or DC voltage change.
References
- HumSilencer: A smart and simple Axon Digidata 1550 Series feature for eliminating line-frequency noise. Molecular Devices Application Note