
Application Note
High-throughput screening of 3D cell cultures with multiple high density scaffold-free spheroids for cancer toxicity studies
- Easily increase the number of spheroids per experimental condition
- Grow, stain, and image large numbers of spheroids simultaneously
- Use high-content imaging for simultaneous 3D analysis of multiple spheroids or organoids
Angeline Lim, PhD | Applications Scientist | Molecular Devices
Introduction
3D spheroid models for cancer research are gaining popularity because they better mimic the in vivo tissue architecture, gene expression and metabolic profile of tumors compared to traditional 2D culture models1,5,6. Previous studies have shown that 3D cultures exhibit several in vivo tumor features such as cell-cell/ECM interactions, drug penetrance, dose response and resistance7 . Similar to solid tumors, spheroids consist of an outer cell proliferation zone, followed by a middle layer of quiescent cells and an inner necrotic core where cells are exposed to hypoxic conditions. These similarities suggest that 3D models would allow for better assessment of drug safety and lead to successful identification of anti-cancer compounds4.
Various techniques have been developed for spheroid generation. In principal, these approaches use either cell attachment resistant surfaces or physical forces to promote cell-cell interaction. The spinner flask/NASA bioreactor system uses continuous motion to prevent cells from adhering to the flask surfaces which promotes cell-cell adhesion. The magnetic levitation method uses magnetic field to cluster iron oxide nanoparticle-containing cells together to form spheroids. While the spinner flask and magnetic levitation methods may generate large quantities of spheroids, uniformity is poor and the ratio of spherical spheroids is low2. The hanging drop method uses drops of cell suspension hanging from the bottom of a culture dish. Spheroids formed in these droplets are then transferred to a cell culture plate for further assays.
Without automation, this technique is labor intensive and time consuming, thus limiting its use to small scale studies. A popular method to generate spheroids uses plates with round U-bottom wells coated with low attachment materials. This scaffold-free approach offers a relatively simple workflow and is compatible with high-content imaging. In addition, spheroid size can be easily controlled and spheroid uniformity is high2. Previous work has been done to optimize workflow in round bottom plates with a one-step staining procedure that reduces assay time and minimizes variability3 . However, a drawback in using U-bottom plates is that only a single spheroid can be generated in each well. To increase data points, replicate wells will be required which is time consuming and ultimately drive up screening cost with increased reagent and test compound usage.
Arrays of microwells patterned on low attachment surfaces have emerged as a solution to generate multiple, consistently sized spheroids. Corning® Elplasia® plates are designed with microcavities within standard culture plates (6-, 24-, 96-well). Each well is coated with an ultra-low attachment surface to enable spheroid formation. Compared to standard workflow in U-bottom plates which generate one spheroid per well, the Elplasia plate can generate on average, up to 78 spheroids per well in a 96-well plate. This allows for multiple spheroids to be grown and treated under the same condition which maximizes the data output. In addition, this method can be applicable for studying clonal heterogeneity of tumor tissues and to increase amount of material for gene expression or metabolomic profiling5,8.
Here, we demonstrate the use of the Elplasia 96-well plates with a 3D culture workflow that includes spheroid generation, compound treatment, cytotoxicity assay, highcontent imaging on the ImageXpress® Micro Confocal High-Content Imaging System, and 3D image analysis using MetaXpress® High-Content Image Acquisition and Analysis Software. The ability to easily generate multiple spheroids and to seamlessly integrate the workflow with high-content imaging will have significant applications in drug discovery and compound toxicology.
Methods
Cell culture
HCT116 cell line (ATCC) was used to generate spheroids. Elplasia plates were pre-wet and handled according to manufacturer’s protocol. Cells were plated in the Elplasia 96-well plate (#4442) at 50,000 cells in a total of 100 µL of McCoy media (supplemented with 10% FBS). Cells were incubated at 37°C for 24 hours to allow spheroid formation before compound treatment.
Cells were visually inspected on a tissue culture microscope to verify formation of spheroids before compounds were added. The following compounds were used here: Cytarabine, doxorubicin (Dox), etoposide, staurosporine and taxol. Compounds were tested in duplicate wells in a seven point, 1:5 dilution series plus control. Spheroids were incubated with the compounds for six days in total, fresh compound added on day three.
Staining
For live cell toxicity assay, spheroids were stained with a mixture of the following dyes with final concentrations as indicated: 3 µM Calcein AM (Life Technologies), 2 µM Ethidium Homodimer III (EthD-III) (Molecular Devices), and 33 µM Hoechst 33342 (Life Technologies). Dye solution was prepared immediately before use and total volume of 10 µL was added to each well. Spheroids were incubated with dye for two and a half hours at 37°C before imaging.
Image acquisition
Images were acquired using the ImageXpress Micro Confocal system (Molecular Devices) using the 10X objectives. Confocal pinhole size = 60 µm. A stack of 12 images were acquired, with a step size of 5 µm to cover at least half the volume of the spheroid.
Analysis
3D image analysis was carried out using Custom Module editor in MetaXpress software. The analysis identifies spheroids using the Hoechst stained image with the 3D function Find Spherical Objects algorithm. Count Nuclei module was used to identify total number of cells based on Hoechst staining. Live/dead module was used to quantify the number of dead (EthD positive) and live (Hoechst positive, Eth negative) cells. Because dead cells may no longer show the Hoechst stain, Cell Scoring module was used to identify all EthD positive cells. The object mask for total cells, live, and dead cells in all planes were joined to form 3D objects by using the Connect by Best Match algorithm. Dose response analyses were carried out in SoftMax® Pro Software using the 4 parameter-logistic curve fit. Statistical analysis and graphs were done in Microsoft Excel.
Results
Typical scaffold-free method for spheroid generation uses ultra-low attachment U-bottom plates which generate one spheroid per well. To increase data points, replicate wells will be required which is often labor intensive and ultimately drive up screening costs. The Elplasia 96-well plate can form as many as 78 spheroids in a single well, with each spheroid nestled in a microwell. Spheroids formed in these microwells are consistent in size and shape, resulting in improved reproducibility (Figure 1). The plates are compatible with ImageXpress high-content imaging systems allowing for different biological readouts depending on the assay used.
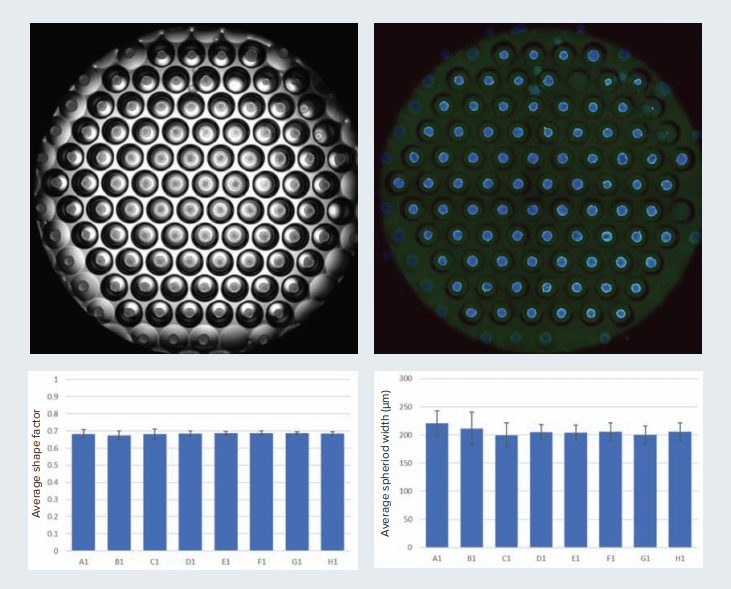
Figure 1. Multiple spheroids can be generated in the Corning Elplasia plate. View of one well in the 96-well Elplasia plate is shown here. Image was acquired using the 4X objectives (four sites, then stitched). Transmitted light and fluorescent image is shown. Variability in size and shape of spheroids often affects reproducibility of results. Diameter and shape factor (measure of circularity where 1 indicates a perfect circle) of spheroids were measured to assess spheroid uniformity. Graphs show average shape factor and the average spheroid diameter (with standard error) from eight control wells.
Spheroids were treated with different classes of anticancer compounds for six days and then assessed for cell viability. Spheroids were stained with Hoechst (nuclei), Calcein AM (live cells), and EthD (dead cells) (Figures 2 and 3). To minimize disturbance to the spheroids and simplify the staining process, the dyes were left in the wells and not washed out after incubation.
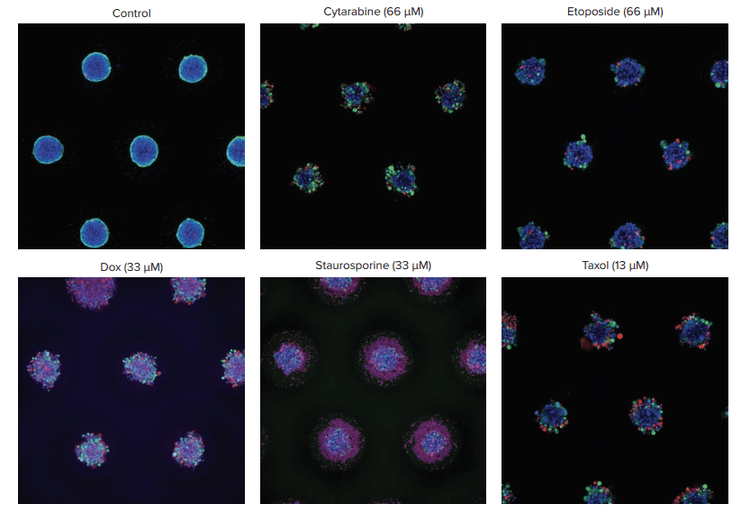
Figure 2. Representative images of control vs. treated spheroids. Spheroids were stained with Hoechst nuclear dye (blue), Calcein AM for live cells (green), and EthD for dead cells (red). Images were acquired with 10X objectives, using the z-stack function. Maximum projection images shown. Treated spheroids show a range of phenotypic effects, most of them lose their compact spheroid structure with cells detaching from the main spheroid.
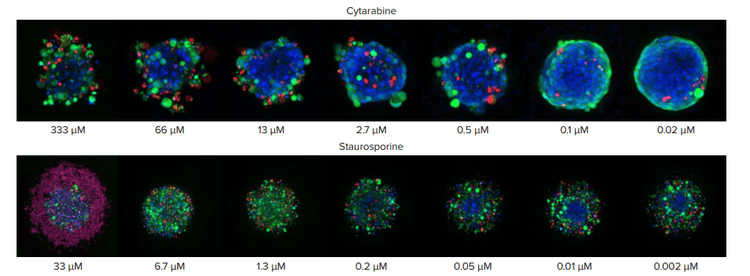
Figure 3. Spheroids treated with different concentrations of cytarabine and staurospoine. Note the differences in spheroid structure in response to the two different compounds. Cytarabine treatment results in a less compact structure with cells detaching from the spheroid. Staurosporine treatment results in dispersed and flattened spheroid morphology, with large number of dead cells especially at high concentrations.
To quantify the effects of compound treatment on cell viability, images were analyzed in MetaXpress software using the custom module editor (CME) with 3D analysis. Spheroid diameter, volume, and the number of dead and live cells were measured.
Cytotoxic and cytostatic effects were observed as a result of compound treatments. Overall, we observed a decrease in the number of live cells (EthD negative) with all compounds. The number of dead cells (EtHD positive cells) was increased, especially as a result of treatment with staurosporine and doxorubicin, showing cytotoxic effect. The total number of cells was decreased as a result of treatment with taxol and etoposide, demonstrating mostly cytostatic effect of those compounds at tested concentrations (Figures 4C and 4D).
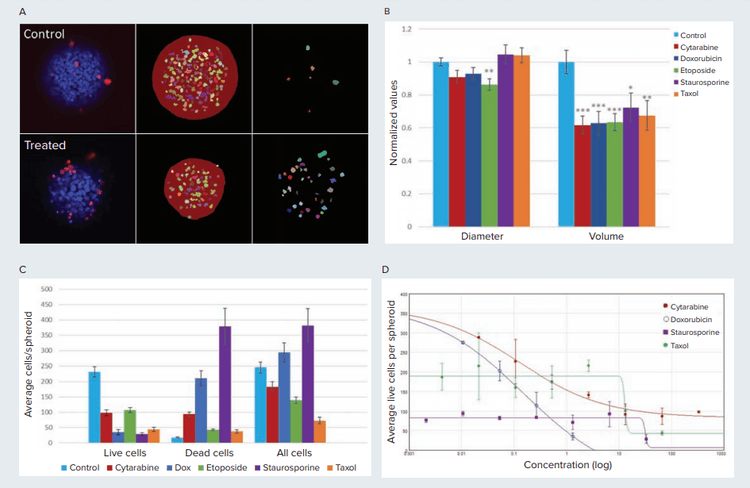
Figure 4. Cytotoxic effects on spheroids shown for control and compound treated cells. A) Image analysis mask shown for a single plane for control and cytarabine treated (13.3 µM) spheroid. Middle column shows mask for spheroid and live cells (EthD negative). Column on right shows mask for dead cells (EthD positive). B) With the exception of etoposide, treated spheroids show no significant change in spheroid diameter compared to untreated spheroids. In contrast, treated spheroids show a 20% to 40% reduction in volume. * p<0.05, **p<0.01, ***p<0.001. Cytarabine (333 µM), Doxorubicin (1.3 µM), Etoposide (333µM), Staurosporine (33.3µM), Taxol (67 µM). C) Compound treated cells on average have fewer live cells and more dead cells per spheroid (p<0.001). D) The average number of live cells per spheroid plotted against compound concentration with a 4-parameter curve fit. The EC values are as follows: Cytarabine = 0.128 µM, Doxorubicin = 0.156 µM, Staurosporine = 31.78 µM, Taxol = 13 µM. The high EC values for staurosporine and taxol suggests cytostatic effects of these compounds before cytotoxicity is observed.
A concentration dependent decrease in live cells was observed in treated spheroids. Treatment with cytarabine, doxorubicin and cytarabine induced concentration dependent decrease in live cell counts and a corresponding increase in dead cell counts. Spheroids treated with taxol show a reduction in spheroid size but not in number of live cell count suggesting cytostatic effects. Cytotoxicity was observed at higher taxol concentration (13.3 µM) with a 3-fold reduction in number of live cells.
We also evaluated the effects of compounds on spheroid size, by measuring the diameter and volume (Figure 4B). Interestingly, compound treated spheroids (cytarabine, doxorubicin, staurosporine and taxol) did not show significant differences in observed diameters compared to the control samples. However, treated spheroids show significant reduction in spheroid volume compared to the controls. Reduced spheroid volume without a decrease in diameter indicates a collapsed spheroid structure where the 3D morphology is no longer maintained. Because diameter can be measured with just 2D analysis, the differences between volume and diameter suggests that using 3D analysis is more representative for studying the effects of compound toxicity on spheroids.
While the number of live cells in spheroids can be used to determine the effective concentrations of compounds that cause phenotypic changes, other measurements from the 3D analysis can provide additional information about specific effects (e.g. number of dead cells, total cell count, and intensity).
Conclusion
We show that multiple spheroids can be easily generated in Corning Elplasia 96-well microplates, treated with compounds, stained, and then imaged on the ImageXpress Micro Confocal system. 3D image analysis of spheroids using the MetaXpress software allows for quantitative assessment of the effects of compounds on spheroids. The workflow, from start to finish, has been optimized for rapid drug screening using 3D cultures.
References
- Nath, S. & Devi, G. R. Three-dimensional culture systems in cancer research: Focus on tumor spheroid model. Pharmacol. Ther. 163, 94–108 (2016).
- Zanoni, M., Piccinini, F., Arienti, C. et al. 3D tumor spheroid models for in vitro therapeutic screening: a systematic approach to enhance the biological relevance of data obtained. Sci Rep 6, 19103 (2016).
- Sirenko O, Mitlo T, Hesley J, Luke S, Owens W, Cromwell EF. High-content assays for characterizing the viability and morphology of 3D cancer spheroid cultures. Assay Drug Dev Technol. 2015;13(7):402–414.
- Kimlin LC, Casagrande G, Virador VM. In vitro three-dimensional (3D) models in cancer research: an update. Mol Carcinog. 2013;52(3):167–182.
- Sakai Y, Yamagami S, Nakazawa K. Comparative analysis of gene expression in rat liver tissue and monolayer- and spheroid-cultured hepatocytes. Cells Tissues Organs. 2010;191(4):281–288.
- Santini MT, Rainaldi G, Romano R, et al. MG-63 human osteosarcoma cells grown in monolayer and as three-dimensional tumor spheroids present a different metabolic profile: a (1)H NMR study. FEBS Lett. 2004;557(1-3):148–154.
- Fischbach C, Chen R, Matsumoto T, et al. Engineering tumors with 3D scaffolds. Nat Methods. 2007;4(10):855–860.
- Greaves M, Maley CC. Clonal evolution in cancer. Nature. 2012;481(7381):306-313. Published 2012 Jan 18.