
Application Note
Counting cells with the Transmitted Light Analysis Module in MetaXpress
- Segment and count objects using transmitted light imaging
- Monitor cell proliferation in transmitted light
- Assess the effects of TL Cell Segmentation Algorithm and use of multiple assays
- Understand the tool for the quantification and analysis of multiple cell types and sizes
Introduction
Matthew Hammer | Applications Scientist | Molecular Devices
Label-free cellular assays are required for a multitude of biological applications that monitor the cell number, proliferation, health, confluency, and cytotoxicity. These applications necessitate efficient and robust transmitted light (TL) imaging and analysis capabilities providing precise segmentation for quantitation of cells and assessment in variety of cell responses and morphologies. Additionally, the coupling of high-contrast transmitted light imaging and fluorescent labeling and imaging is essential to numerous cellbased assays.
The TL Cell Segmentation Algorithm within the MetaXpress® 6.5 Custom Module Editor is an optimizable and reliable analysis algorithm for the quantitation of cells imaged using transmitted light. In this application note we demonstrate the utility and accuracy of the TL Cell Segmentation Algorithm in analyzing and quantifying CHO and HeLa cells by comparing total cell count in transmitted light with a fluorescently stained nuclei count. (Figure 1)
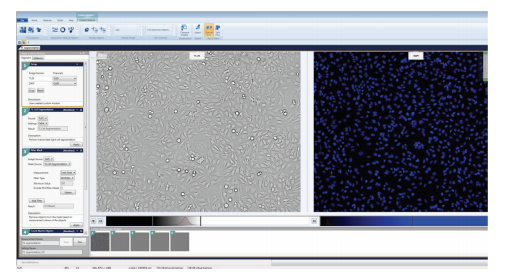
Figure 1. Setting up the Custom Module for analyzing HeLa and CHO cells captured in transmitted light. The cells were stained with Hoechst 33342 nuclear dye. The cells were imaged in TL and with the DAPI filter, and the Custom Module was configured to analyze and quantify cells based on transmitted light imaging and fluorescent imaging of nuclei.
Methods
CHO and HeLa cell dilutions were plated into 96-well, black, clear bottom microplates, starting at 20,000 cells per well in the top row of the plate. The dilutions for each cell type were run in sextuplets, and the cells were diluted 1:2 down the plate. 24 hours after plating, the cells were stained with Hoechst 33342 nuclear dye for 30 minutes in a 37°C, 5% CO2 incubator. The cells were then fixed with 4% paraformaldehyde and washed twice with DPBS. The cells were imaged with the ImageXpress® Micro High Content Imaging system and the MetaXpress software. One field of view was imaged with a 10x Plan Fluor objective, which accurately captured up to 1500 cells. The images were taken with transmitted light and the DAPI fluorescence channel, and the exposure times were 15 ms and 35 ms respectively
Configuring the TL tell segmentation algorithm in custom module editor
Accurate cell segmentation is essential for the quantification of cells captured with transmitted light. Cell A was selected for TL Cell Segmentation since this algorithm most precisely segmented and masked both the HeLa and CHO cells (Figure 2). There are other settings to choose from, Cell B or Cell C, which can be used to analyze small or large cells respectively. A Filter Mask was added to the module to filter out cells that did not have a total area greater than or equal to 150 µM2 (Figure 3). This ensured that small, rounded up dead cells were not counted and analyzed as live cells. Additionally, the Nuclei Count Objects Algorithm was configured to accurately quantitate the nuclei of the HeLa and CHO cells (Figure 4).
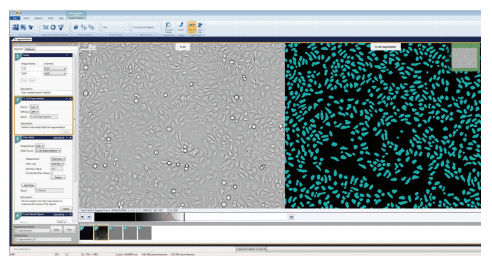
Figure 2. Applying the TL Cell Segmentation Algorithm to the selected transmitted light image of HeLa cells. In the Custom Module Editor, the TL Cell Segmentation Algorithm is configured by selecting the source wavelength and the setting that represents your cell type. Cell A best masked the HeLa and CHO cells that were imaged.
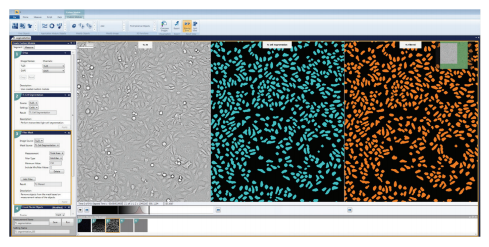
Figure 3. Comparative images of the TL Cell Segmentation overlay and Filter Mask overlay. A Filter Mask was configured to filter out cells based on a minimum total area requirement, which was set as 150 µm2.
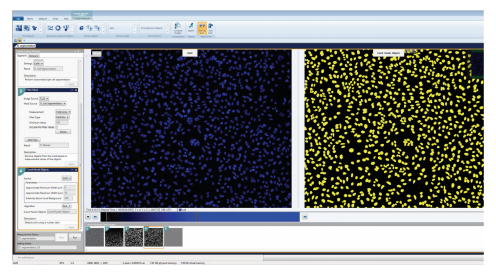
Figure 4. Count Nuclei Objects segmentation of fluorescent nuclei image. Count Nuclei Objects was utilized to quantitate cells based on their nuclei, which were stained with Hoechst 33342. The approximate minimum and maximum width as well as the intensity above local background parameters were optimized to accurately mask all nuclei. (Left) The nuclei are in blue, and (Right) the analysis masks are in yellow.
Cell count in transmitted light correlates with fluorescent nuclei count
The Custom Module that was configured with the TL Cell Segmentation Algorithm precisely segmented both the HeLa and CHO cells (Figure 6). Total cell count in transmitted light and nuclei count were not statistically different, highlighting the accuracy of the TL Cell Segmentation Algorithm (Figure 7). In addition to cell count, the generation of multiple readouts to evaluate different characteristics of cellular responses and morphology is enabled by the TL Cell Segmentation Algorithm (Figure 5). For example, total and average counts, area, intensities, integrated intensities, shape, height, and width, along with a wide variety of additional readouts can be produced for cells and objects within cells. The use of a Filter Mask to exclude rounded-up dead cells further facilitates this, as well as alleviates the need for the use of live cell or whole cell stains. Furthermore, the use of the nuclear stain and Count Nuclei Objects Algorithm demonstrates that multiple readouts can be produced from the analysis of fluorescently labeled or stained objects within cells imaged in transmitted light.
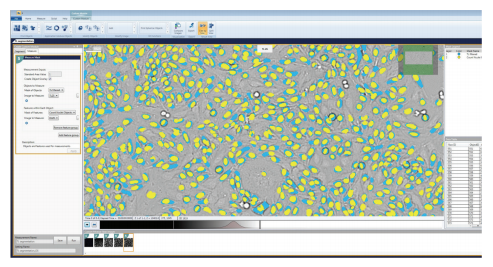
Figure 5. Representative image of HeLa cells with the configured Custom Module image analysis masks overlaid. The blue masks represent the cells that were found by the TL Cell Segmentation Algorithm with the TL Filter Mask, and the yellow represents the nuclei found by the Count Nuclei Objects Algorithm. The desired measurements for the Custom Module were configured in the Measure tab. The Objects to Measure were defined as the objects masked by the TL filtered Cell Segmentation, and the Count Nuclei Object mask was selected to measure the Feature within Each Object.
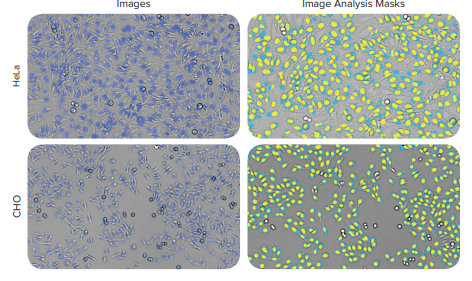
Figure 6. Images of HeLa and CHO cells, along with the image analysis masks from the optimized TL Cell Segmentation Custom Module. (Left) the DAPI nuclei are shown in blue and (Right) are yellow in the image analysis masks, while the cells in transmitted light are masked in light blue. The images were captured on the ImageXpress Micro system with a 10x Plan Fluor Objective, and were analyzed with a Custom Module configured with the new TL Cell Segmentation algorithm.
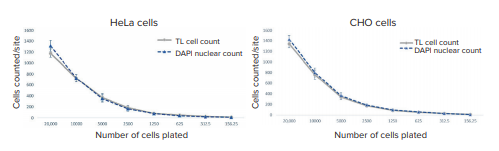
Figure 7. Comparison of total cell counts for HeLa and CHO cells based on the TL Cell Segmentation and Count Nuclei Objects module. The cells were diluted 1:2, starting from a concentration of 20,000 cells per well.
Conclusion
The TL Cell Segmentation Algorithm in the Custom Module Editor of MetaXpress provides an effective tool for the quantification and analysis of multiple cell types and sizes. The optimal segmentation capabilities aided by the ImageXpress® Micro Confocal High-Content Imaging System enables the analysis of fluorophore-independent morphology. The capability to quantify cells using transmitted light images adds flexibility to a researcher’s assay capabilities. The method described here demonstrates that the TL Cell Segmentation Algorithm can be used for multiple assays including, but not limited to, proliferation, cytotoxicity studies, and transfections.