
Application Note
Improve sensitivity, speed, and assay quality for complex biological assays
- Increase image intensity and assay sensitivity with laser light source
- Reduce exposure time by 3-4X, and correspondingly reduce imaging time by 1.5-3X
- Ensure higher quality images for your assays
Oksana Sirenko, PhD | Sr. Research Scientist | Molecular Devices
Jayne Hesley | Sr. Applications Scientist | Molecular Devices
Matt Chan | Optical Engineer | Molecular Devices
With the increasing use of highly-complex cell-based 2D and 3D assays in biologic research, there is a pressing demand for improvements to the capabilities of automated high-content imaging. Here, we demonstrate improvement in assay sensitivity, quality, and speed of acquisition with the ImageXpress® Confocal HT.ai High-Content Imaging System. Using a high-power laser light source, the system significantly increases light throughput to the sample, which results in brighter images, increased sensitivity, and increased assay throughput. The impact is especially important for the assays where sensitivity and imaging time are the limiting factors. To demonstrate the practical impact of laser light sources, we present results from several complex biological assay systems: a GPCR activation assay, cancer spheroids, and lung organoids.
Methods
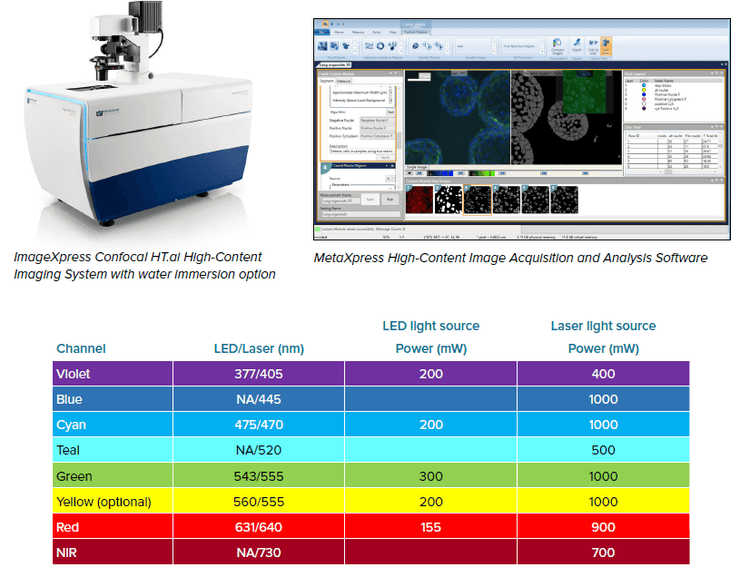
The Instrument
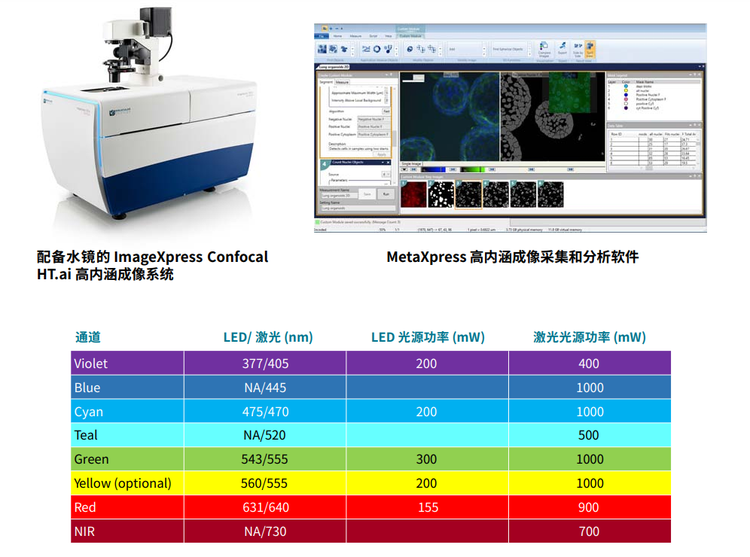
The ImageXpress Confocal HT.ai system is equipped with a multi-line laser light source with matched filters, spanning 405 nm to 730 nm excitation. This light source provides drastically increased illumination power to the sample in comparison to the previous-generation LED light source.
In the examples presented below, comparisons were done between the ImageXpress Confocal HT.ai system and the previous generation ImageXpress Micro Confocal system.
Cell assays
The Transfluor® Assay was performed as previously described using cell line expressing GFP-tagged betaarrestin that associates with the receptor of interest upon activation1. Cells were stimulated with isoproterenol causing dose-dependent appearance of aggregated internalized receptors (pits), that were visualized with a 20X Plan Apo objective (60’ spinning disc) in the FITC channel.
3D spheroids were formed from an HTC116 colon cancer cell line (ATCC) using U-bottom low attachment (Corning) microplates as previously described2 (Sirenko, 2015). Spheroids were treated for 48 hours with anti-cancer drugs, fixed and stained with DRAQ5, HCS CellMask Orange or AF555 Phalloidin, and Whole Cell Green or AF488 Phalloidin (Thermo Fisher Scientific). Spheroids were imaged in 3D (Z-series with 5 μm steps) using a 20X Plan Apo objective. Cell analysis was performed on maximum projection images in MetaXpress® High-Content Image Acquisition and Analysis Software.
3D organoids were formed from primary human lung epithelial cells (ScienCells) in Matrigel (Corning) domes, prepared using a Stem Cell Technologies kit and protocols3. Mature lung organoids (after six weeks of development) were fixed and stained with Hoechst, MitoTracker Orange, and AF488 Phalloidin. Organoids were imaged at 10X magnification in 3D (Z-stack covering a range of 150-250 μm deep) and the images were analyzed using MetaXpress 3D image analysis tools.
Results
GPCR activation assay, Transfluor
G-protein coupled receptors are the largest class of pharmaceutical targets that play a major role in biological screening assays. The Transfluor Assay quantitates internalization of GFP-tagged beta-arrestin that associates with the activated receptor of interest. This internalization results in the appearance of small fluorescent pits that are counted and characterized by high-content imaging. Pits are relatively dim and require \~1 sec exposure with an LED light source. The laser light source of the ImageXpress Confocal HT.ai system reduced exposure time by 3-4X, and correspondingly reduced imaging time by 33% (1.5X gain in assay speed). In addition, assay Z’ values also increased by approximately 20%.
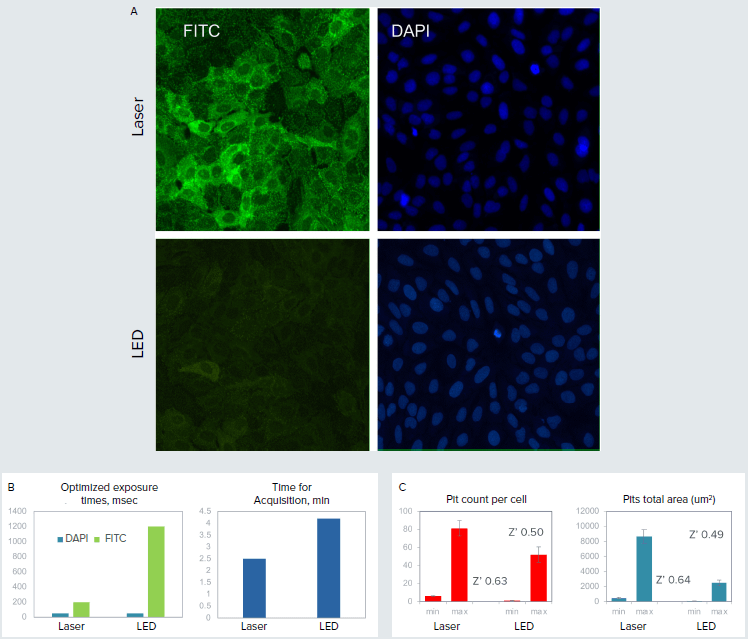
Figure 1. A. Small dots (pits) in green formed upon receptor activation with isoproterenol. Nuclei were stained with Hoechst (blue). Images were acquired using the same exposure times for LED and laser light sources (optimized for lasers). B. Optimized exposure times and duration of imaging were substantially reduced using the laser light source. C. The assay quality (Z’ value) was compared for images taken with laser and LED systems.
3D cancer spheroids
In the second assay, we compared a standard imaging system ImageXpress Confocal with LED excitation to one with laser excitation. HCT-116 spheroids were grown for four days in round bottom plates, with some wells receiving anti-cancer compound treatment with 5 μM of either Cytochalasin D or Nocodazole for the last two days. Spheroids were fixed and stained with either DRAQ5 (nuclei), Whole Cell Green, and Alexa Fluor 555 Phalloidin (actin); or DRAQ5, HCS CellMask Orange (whole cell), and Alexa Fluor 488 Phalloidin (actin). Z-series images were acquired with a 20X Plan Apo objective to a spheroid depth of 150 μm (31 steps at 5 μm step size). Image analysis was performed on the maximum projection images to count nuclei and determine spheroid area. The images were taken using an exposure that yielded a 14-bit image whether acquired using LED or Laser excitation. By independently optimizing exposure times for each light source, 3D spheroid acquisition was performed in approximately half the time using lasers vs LED, depending upon number of channels collected and fluorophores used.
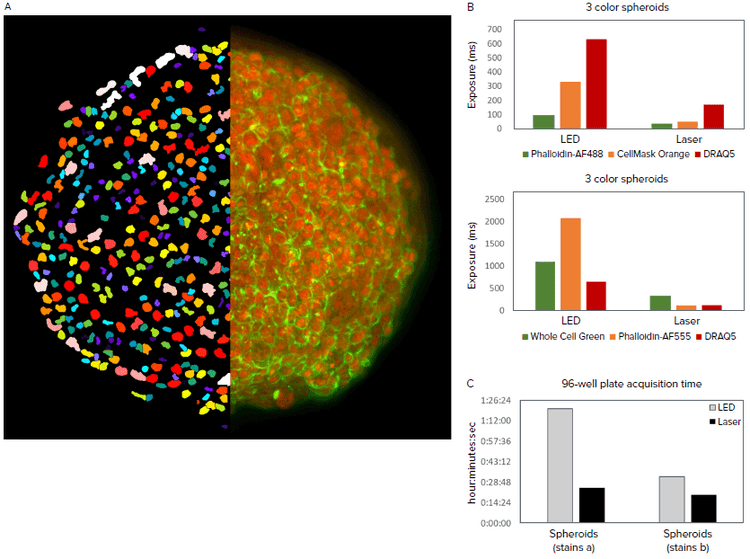
Figure 2. A. 2D projection image of DRAQ5 and Phalloidin-AF488 overlay of an untreated spheroid (right half) and nuclear segmentation mask (left half). B. Exposure times optimized to acquire images of equivalent pixel intensities. Different exposures were required for different staining protocols. C. Speed of acquiring a 96-well spheroid plate in the ImageXpress Confocal HT.ai system at 20X using LED vs laser light sources.
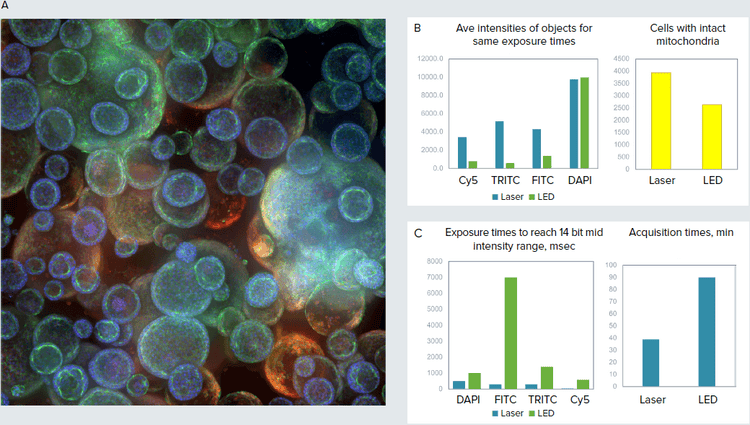
Figure 3. A. Confocal image of organoid culture in Matrigel (maximum projection), 10X. B. Images were taken using same exposure times for LED and laser light sources. Cell count and average intensity of objects (cells with intact mitochondria) shown for representative images. C. Exposure times were matched (14 bit intensity range) for both laser and LED. Optimized exposure times and duration of imaging were substantially reduced by using lasers.
3D lung organoids
The lung organoid cultures were started from primary lung epithelial cells, and then grown in Matrigel domes using reagents and protocol from Stem Cell Technologies. Briefly, cells were first expanded in 2D, then mixed with growth factor reduced Matrigel and seeded into Matrigel domes in 24-well plates, or other plate formats. Organoids are a very useful tool for disease modeling and assessment of compound effects. Automated imaging and analysis of organoids are important methods for quantitative assessment of phenotypic changes in organoids, and for increasing the throughput of organoid experiments. Confocal Imaging and 3D image analysis are especially useful for capturing the complexity of 3D biological systems.
We have evaluated the impact of lasers on imaging of 3D organoid samples. Organoids comprised spherical objects with complex cavities and vesical structures that were imaged using 20-30 Z-planes through the Matrigel with 10X-40X magnification. Organoids were treated with compounds known to damage lung tissues, and were stained with markers visualizing mitochondria, cytoskeleton, and cell junctions. 3D volumetric analysis was performed to count and characterize organoids and cells inside the organoids. We were able to observe increased pixel intensity, resolution, and sharpness of objects that resulted in higher quality analysis. Importantly, the speed of imaging was increased 2.3X (51-57% time reduction) due to an 8X decrease in total exposure time.
Implications of laser light source for assay speed and throughput
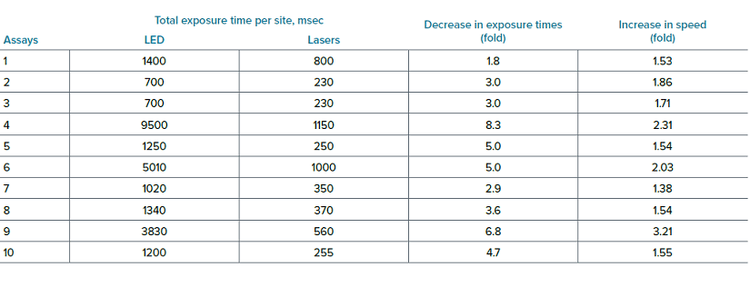
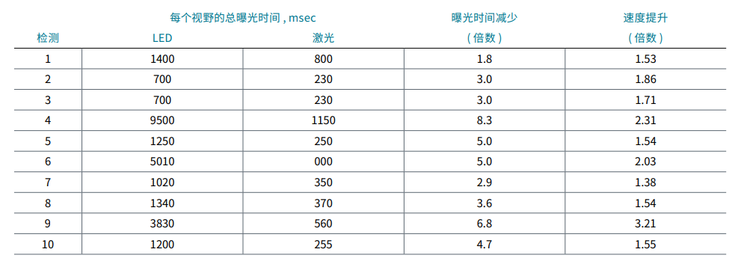
To test the impact of lasers on assay speed and throughput of high-content screening assays we have compared exposure times and acquisition speed for 10 independent assays performed by five scientists. The data below illustrate the observed decrease in exposure times and increased speed (time reduction) for these 10 assays.
Conclusion
The illumination power of the laser light source significantly increases image intensity and assay sensitivity, which is especially important for dim samples. The imaging system with lasers substantially decreased exposure times, which resulted in increased imaging speed and assay throughput. 3D imaging especially benefited from the laser light source. We characterized several biological assays and demonstrated higher image intensities and improved image quality, which resulted in increased assay sensitivity and imaging speed.
- Transfluor, MolDev https://www.moleculardevices.com/en/assets/app-note/dd/img/gpcr-activation-using-metaxpress-acuityxpress-software-and-transfluor-assay-system
- Sirenko et.al., 2015, Assay and drug development technologies https://www.liebertpub.com/doi/pdfplus/10.1089/adt.2015.655
- Stem Cell Technologies, https://www.stemcell.com/pneumacult-airway-organoid-kit.html
Oksana Sirenko, PhD | Sr. Research Scientist | Molecular Devices
Jayne Hesley | Sr. Applications Scientist | Molecular Devices
Matt Chan | Optical Engineer | Molecular Devices
简介
随着高度复杂的基于细胞的二维和三维分析技术在生 物研究中的应用日益广泛,人们迫切需要提高自动化高 内涵成像能力。在此,我们展示了使 用 ImageXpress® Confocal HT.ai 高内涵成像系统在检测灵敏度、分析质 量和采集速度方面的提升。使用高功率激光光源,该系 统可显著增加样品的光通量,从而产生更明亮的图像、更 高的灵敏度和更高的检测通量。这种影响对于灵敏度和 成像时间是限制因素的检测尤其重要。为了证明激光光 源的实际影响,我们展示了几个复杂生物学的检测系统结 果:GPCR 活化检测、肿瘤细胞球和肺类器官。
方法
仪器
ImageXpress Confocal HT.ai 系统配备了多线激光光源 与相匹配的滤片,跨越 405nm 到 730nm 激发。与上一 代 LED 光源相比,该光源为样品提供了显著增强的照明 功率。
在下面的示例中,比较了 ImageXpress Confocal HT.ai 系统和上一代 ImageXpress Micro Confocal 系统。
细胞检测
如前所述,使用表达 GFP 标记的 beta- arrestin 的细胞 系进行 Transfluor® 检测,该细胞系在激活时与感兴趣 的受体相关 1 。用异丙肾上腺素刺激细胞,引起聚集的内 化受体 (pits) 的剂量依赖性表现,这些受体在 FITC 通道 中用 20X Plan Apo 物镜 (60′ 转盘 ) 呈现出来。
如 前 所 述, 使 用 U 型 底 低 附 着 (Corning) 微 孔 板 从 HTC116 结 肠 癌 细 胞 系 (ATCC) 形 成 3D 细 胞 球 2 (Sirenko, 2015)。细 胞 球用抗 癌 药物处 理 48 小时,用 DRAQ5、HCS CellMask Orange 或 AF555 Phalloidin 和 Whole Cell Green 或 AF488 Phalloidin (Thermo Fisher Scientific) 固定和染色。
细胞球用 20X Plan Apo 物镜进行 3D ( 5 μm 步进 Z 轴系 列 ) 成像。在 MetaXpress® 高内涵图像采集和分析软件 中对最大投影图像进行细胞分析。
3D 类 器 官 是 由 原 代 人 肺 上 皮 细 胞 (ScienCells) 在 Matrigel (Corning) 圆 顶 中 形 成 的, 使 用 Stem Cell Technologies 试 剂 盒 和 方 案 制 备 3 。成熟的肺类器 官 ( 发 育 6 周 后 ) 被 固 定 并 用 Hoechst、MitoTracker Orange 和 AF488 Phalloidin 染色。10X 放大倍率以 3D (Z-stack 范 围 150-250 μm) 方 式 对 类 器官成 像 并 使 用 MetaXpress 3D 图像分析工具分析图像。
结果
GPCR 活化检测 , Transfluor
G 蛋白偶联受体是最大的一类药物靶点,在生物筛选分 析 中起 着重 要作用。Transfluor 检 测 定 量 GFP 标 记 的 beta-arrestin 蛋白的内化,beta-arrestin 蛋白与感性趣 的激活的受体有关。这种内化导致出现小的荧光斑点, 这些荧光斑点通过高内涵成像进行计数和特征描述。 这些斑点相对较暗,用 LED 光源需要 1 秒左右的曝光。 ImageXpress Confocal HT.ai 系统的激光光源可将曝光 时间减少 3-4 倍,与此同时成像时间可减少 33%% ( 获得 1.5 倍 检测速度 )。另外,检测 Z′ 值也提高了约 20%。
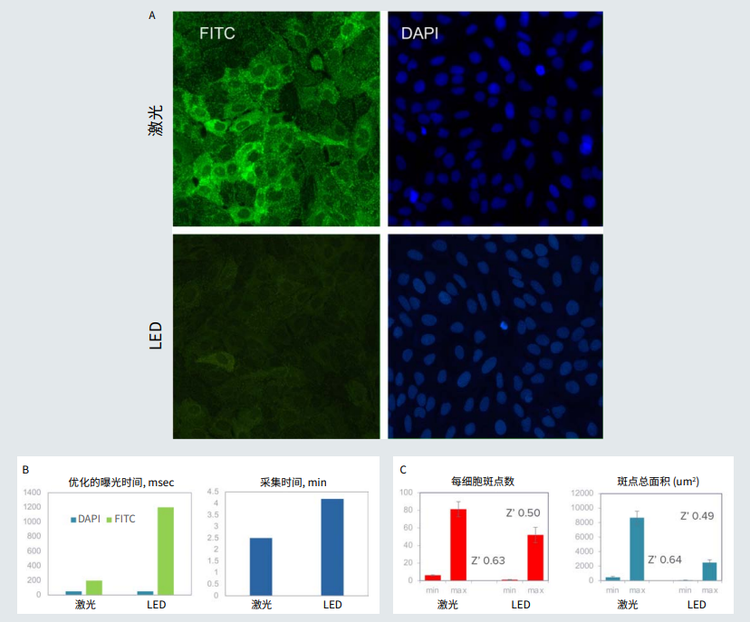
图 1 A. 用异丙肾上腺素激活受体后形成的绿色小点。Hoechst ( 蓝色 ) 染细胞核。对 LED 和激光光源 ( 针对激光进行了优化 ) 使用相同的 曝光时间获取图像。 B. 使用激光光源使优化的曝光时间和成像时间大大减少了。 C. 比较激光和 LED 系统拍摄的图像的检测质量 (Z' 值 )。
3D 癌细胞球
在第二个实验中,我们比较了 LED 激发与激光激发的标 准 成 像 系 统 ImageXpress Confocal。HCT-116 细 胞 球 在圆形底孔板中生长 4 天,一些孔在最后两天接受 5μM 细胞松弛素 D 或诺科达唑的抗癌化合物处理。固定细胞 球并用 DRAQ5 ( 核 )、Whole Cell Green 和 Alexa Fluor 555 Phalloidin ( 肌动蛋白 ); 或 DRAQ5、HCS CellMask Orange ( 全细胞 ) 和 Alexa Fluor 488 Phalloidin ( 肌动 蛋白 ) 染色。用 20X Plan Apo 物镜采集 Z 轴系列图像, 采集的球体深度为 150 μm (31 层,5 μm 步进 )。 对最大投影图像进行图像分析,计算细胞核数,确定球 体面积。这些图像不管使用 LED 还是激光激发采集,都 是以产生 14 位图像的曝光获取的。通过独立优化每个光 源的曝光时间,根据收集的通道和使用的荧光团数量, 使用激光采集 3D 细胞球的时间大约是 LED 采集时间的 一半。
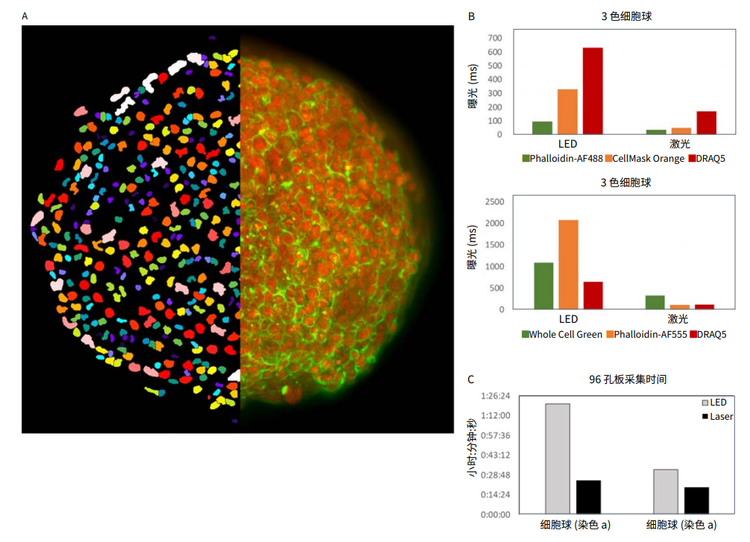
图 2 A. 未处理细胞球 ( 右半边 ) 经 DRAQ5 和 Phalloidin-AF488 染色叠加的 2D 投影图像和核分割掩模 ( 左半边 )。B. 曝光时间优化 以获得同等像素强度的图像。针对不同的染色方法需要不同的曝光。C. 在 ImageXpress Confocal HT.ai 系统中用 20X,对比 LED 和激 光光源采集 96 孔细胞球孔板的速度。
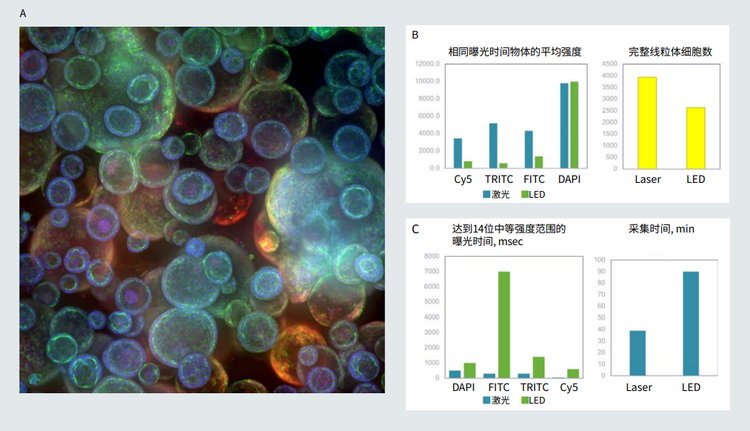
图 3 3 A. Matrigel 中类器官培养的共焦图像 ( 最大投影 ),10X。B. 使用相同的 LED 和激光光源曝光时间拍摄图像。 代表性图像显示的 物体 ( 线粒体完整的细胞 ) 的细胞计数和平均强度。 C. 曝光时间匹配 (14 位强度范围 ) 的激光和 LED。通过使用激光,优化的曝光时间 和成像时间大大缩短。
3D 肺类器官
肺类器官培养从原代肺上皮细胞开始,然后使用 Stem Cell Technologies 的试剂和方案在基质凝 胶圆顶中生 长。简单地说,细胞首先在 2D 中扩增,然后与生长因子 还原的 Matrigel 混合,并以 24 孔板或其他孔板形式接 种到 Matrigel 圆顶中。类器官对于疾病建模和评估化合 物作用是非常有用的工具。类器官的自动成像和分析是 定量评估类器官表型变化和提高类器官实验通量的重要 方法。共聚焦成像和 3D 图像分析对于捕捉 3D 生物系统 的复杂性特别有用。
我们已经评估了激光对 3D 类器官样品成像的影响。类器 官包括具有复杂空腔和囊泡结构的球形物体,这些物体 通 过 Matrigel 用 20-30 层 Z 轴 平 面 以 10X-40X 放 大 倍 率成像。用已知会损伤肺组织的化合物处理类器官,并用 可见的线粒体、细胞骨架和细胞连接的标记物染色。进 行 3D 体积分析以计数和表征类器官和类器官内的细胞。 我们能观察到像素强度、分辨率和物体锐利度的提高,从 而得到更高质量的分析。重要的是,由于总曝光时间减少 了 8 倍,成像速度提高了 2.3 倍 ( 时间缩短了 51-57% )。
激光光源对检测速度和通量的影响
为了测试激光对高内涵筛选分析的检测速度和通量的影响,我们比较了 5 位科学家进行的 10 次独立检测的曝光时间和 采集速度。下面的数据说明了观察到的这 10 次检测的曝光时间减少和速度增加 ( 时间缩短 )。
总结
激光光源的照明功率显著提高了图像强度和检测灵敏度,这对于较暗的样品尤为重要。激光成像系统大大减少了曝光时 间,从而提高了成像速度和检测通量。3D 成像尤其得益于激光光源。我们描述了几种生物学检测,并证明了更高的图 像强度和改善的图像质量,从而提高了检测灵敏度和成像速度。
- Transfluor, MolDev https://www.moleculardevices.com/en/assets/app-note/dd/img/gpcr-activation-using-metaxpress-acuityxpress-software-and-transfluor-assay-system
- Sirenko et.al., 2015, Assay and drug development technologies https://www.liebertpub.com/doi/pdfplus/10.1089/adt.2015.655
- Stem Cell Technologies, https://www.stemcell.com/pneumacult-airway-organoid-kit.html