
Application Note
Automation of an organ-on-a-chip assay: automated culture, imaging, and analysis of angiogenesis
- Increase assay throughput
- Improve data reproducibility
Angeline Lim, Oksana Sirenko | Molecular Devices
Arthur Stok, Matthew Delport | Mimetas
Francis Enane | Beckman Coulter Life Sciences
Introduction
3D cellular models are increasingly popular in many areas of research because they recapitulate the cellular 3D microenvironment better than cells grown in 2D monolayer. The current high failure rates of compounds in clinical studies could be due to the inadequacies of the 2D cell culture system. As such, there is a demand for more physiologically relevant models to enable better drug candidate selection in drug discovery.
Novel methods in cell biology, coupled with innovations in bioengineering have paved the way to the growing use of 3D cultures. These 3D cell models include simple spheroids to more complex structures, such as organoids and organ-on-a-chip (OoC) systems. The increasing complexity of 3D models remains a hurdle for its wide adoption in research and drug screening. Specifically, some of the challenges include the ability to generate uniform 3D structures, reproducible cell seeding, and ultimately, adapting 3D cultures for high-throughput applications. Automation of the cell culture process, end-point assays, and analyses can provide the necessary tools to facilitate and scale up the use of 3D cell models.
To address some of the challenges associated with 3D cell culture, we developed automation methods for an organ-on-a-chip model. The automated method utilizes an integrated workcell comprised of several instruments compatible with the automation and monitoring of cell culture. For proof-of concept, the OrganoPlate® 3-lane 64 (MIMETAS) was used to create a model for angiogenesis. This OrganoPlate type consists of 64 microfluidic units in 384-well imaging quality plate format making it highly suited for automated liquid handling and high-content imaging. Dispensing of the extracellular matrix (ECM) and endothelial cell seeding were performed on a liquid handler. The automation compatible LiCONiC incubator equipped with the Wave function enables continuous perfusion of the microfluidic channels. For extended cell culture, processes such as media exchange can be scheduled in the automation software. For end-point assay readouts, high-content imaging and analyses were used for the quantification of angiogenic sprouts in 3D. The methods developed here for the automation of cell seeding, media exchange, and for the monitoring of quantification of 3D vasculature growth can be further implemented in other applications, such as compound screens and toxicity studies.
Methods
3D angiogenesis model in the OrganoPlate 3-lane
A high-throughput microfluidic platform, called the OrganoPlate, was employed to establish the angiogenesis model. The OrganoPlate 3-lane comprises 64 or 40 tissue culture chips, with each consisting of three channels (Figure 1). A collagen-I extracellular matrix (ECM) gel was seeded in the middle channel of each chip and was patterned by phase-guides. Endothelial cells (primary, cell line, or iPSC-derived) were grown in the right channel of each chip and formed an endothelial vessel under perfusion by placing the OrganoPlate in the LiCONiC Wave incubator programmed to rock the plates at regular intervals to allow flow of media by gravity, simulating perfusion. Addition of a cocktail of angiogenic factors in the left channel induced the directed formation of angiogenic sprouts from the parent vessel. Angiogenic sprouts were allowed to form for 1–5 days and then were fixed and stained for quantitative comparison. Vascular cells and sprouts were fixed with 4% formaldehyde and stained with a primary antibody against VE-cadherin, followed by a secondary Alexa488 antibody (green), and nuclei were stained with Hoechst (blue).
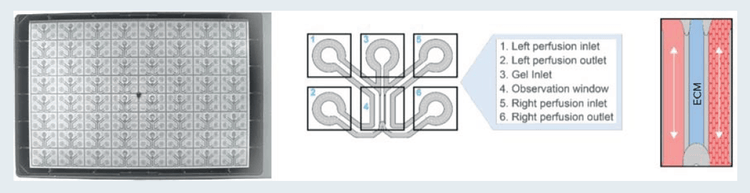
Figure 1. The OrganoPlate 3-lane is comprised of 64 or 40 culture chips. Left: view from the bottom side of the OrganoPlate 3-lane 64. Middle: Schematic representation of an OrganoPlate 3-lane 64 tissue chip. Right: Illustration of a tubule of cells grown against an ECM gel.
Workcell setup for automation
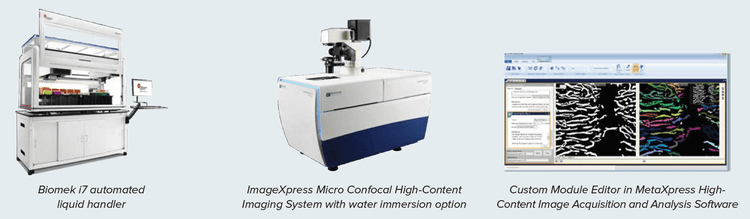
The workcell consisted of the following primary components: Hotel for storage of microtiter plates, LiCONiC STX44 automated incubator with wave function, AquaMax Microplate Washer (Molecular Devices), HiGTM4 automated centrifuge (BioNex Solutions Inc), SpectraMax iD5 Multi-Mode Microplate Reader, ImageXpress Confocal HT.ai system, ImageXpress Pico Automated Cell Imaging System (Molecular Devices), and Biomek i7 Automated Workstation (Beckman Coulter Life Sciences). The plate handling robot is a PreciseFlex400 robot on a 2 meter rail to access all plate nests. The Green Button Go scheduling software is used to create the automation workflow and schedule setup. This software provides single user interface for control of all devices in the workcell.
For automation of the OrganoPlate, the Biomek i7 automated workstation was used for plate preparation (ECM seeding) and cell seeding. The Biomek i7 workstation can also be used for addition of growth factors, media exchange, and cell fixing and staining. Transfer of the OrganoPlate can be done with the PreciseFlex400 robot to the Biomek i7 liquid handler for media changes. Transfers from the incubator to the imager can also be set up for long-term discontinuous monitoring of cells.
Results
The cell culture process is typically a manual procedure that requires user intervention at multiple points. These processes can be automated with an integrated workcell (Figure 2). For example, microplates can be transferred from the incubator to the sterile liquid handler for media exchange. In addition, compound treatment and end-point assays can similarly be automated. The process for cell culture maintenance (monitoring and feeding), and endpoint assays can be automated, which gives reproducible results, saves on resources, and is highly scalable.
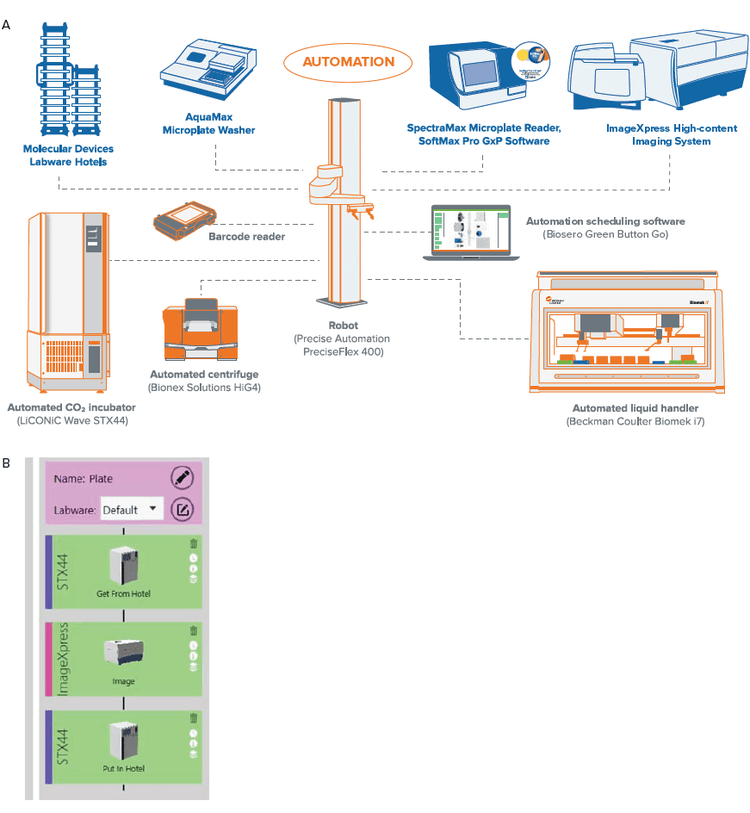
Figure 2. Layout of the individual instruments in the workcell is illustrated in (A). The instruments are controlled by an integrated software (Green Button Go) that allows for set up of processes. An example of the process to monitor cells in culture is shown in (B). Here, the plates are moved from the incubator to the ImageXpress Confocal HT.ai for imaging in brightfield and then back to the incubator. The process can also be scheduled, and plates that need to be imaged can be entered as a list to enable easier batch processing. More complex routines that include the liquid handler for media exchanges (feeding) can also be implemented.
Automation for an angiogenesis model using a scalable microfluidic platform
OoC technology has been successfully used to mimic the physiological organ and its environment. OoC models allow for regulation of key physiological conditions related to the tissue microenvironment such as tissue-organ interactions, cell patterning, tissue boundaries, and concentration gradients.
Here, the the OrganoPlate 3-lane 64 (MIMETAS) is used to model angiogenic sprouting in vitro on an automated platform (Figure 3). The OrganoPlate integrates perfusion and a concentration gradient and can be used to study angiogenic sprouting and microvascular stabilization. Automated liquid handling improves assay reproducibility and increases throughput.
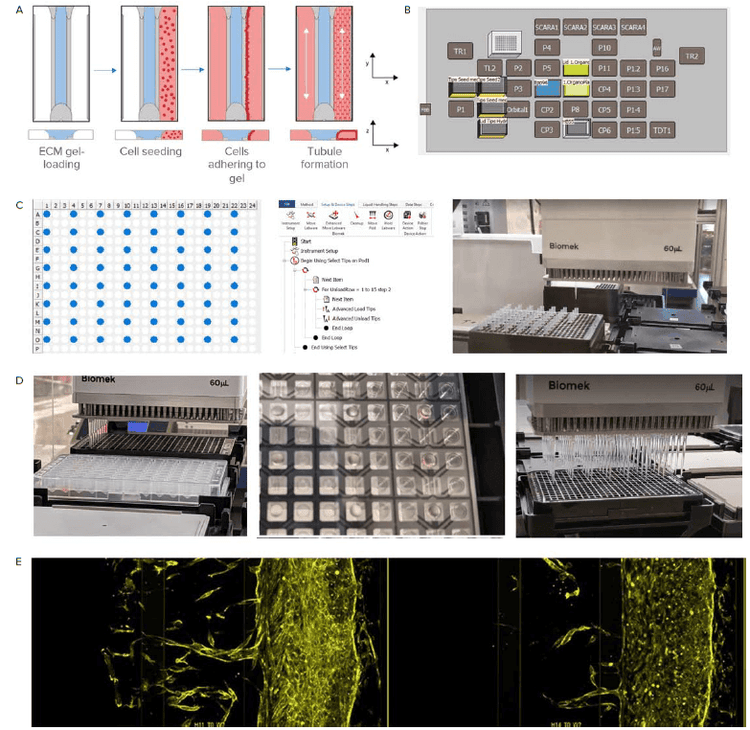
Figure 3. Sample preparation with an automated liquid handler. A) Steps for preparing the OrganoPlate. The Observation window is shown. Blue represents the ECM which is loaded via the gel inlet. Next, cells are seeded in the perfusion channel adjacent to the ECM channel. The OrganoPlate is placed at an angle that allows the cells to settle against the gel and attach. Lastly, the plate is placed on a rocker platform (or the LiCONiC incubator with wave function) to initiate medium perfusion and allow tubule formation. B) The Biomek i7 liquid handler is equipped with 6 heater-cooler thermo block (CP). ECM is kept chilled on these CP positions. C) The Biomek i7 liquid handler can be used to arrange pipette tips to reflect the OrganoPlate format. D) Image on the left shows ECM loading. Image in the middle shows the ECM in the gel inlet and the gel channel after gel loading using automation. Image on the right shows the addition of cell media to the perfusion inlet. E) Angiogenic sprouting in the OrganoPlate 3-lane 64 over time.
Formation of angiogenic sprouts over time
The OrganoPlate 3-lane was used to model angiogenesis. Endothelial cells were seeded to form a tubule. Growth factors were added to the opposite channel to create a concentration gradient across the ECM. Angiogenic sprouts were observed growing towards the growth factor-containing channel (bottom) (Figure 4).
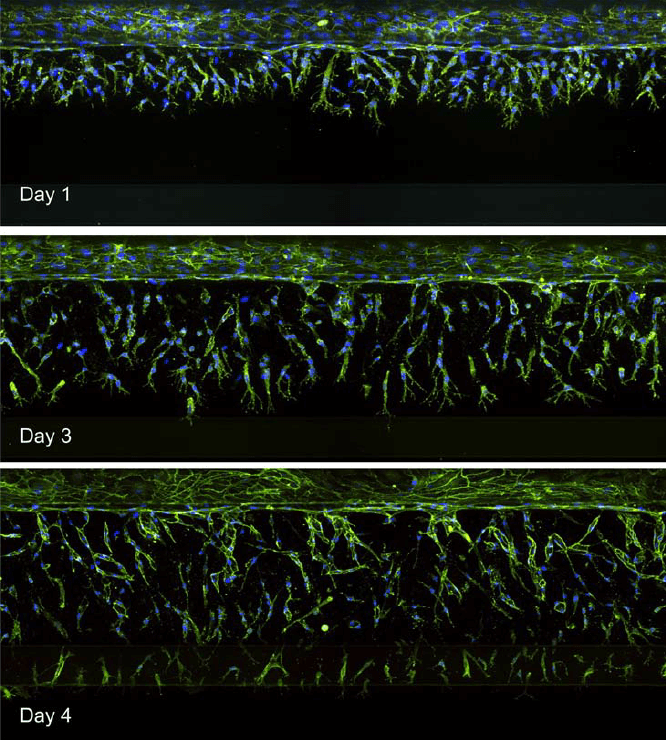
Figure 4. Images of endothelial cells (top channel) growing towards the bottom channel. Maximum projection images are shown representing angiogenic sprouts over time.
3D analysis to quantify angiogenic sprouts over time
Time dependence of angiogenesis was modeled over five days. A time-dependent increase in the number and volume of sprouts was observed, as well as an increased number of cells or nuclei. Images were analyzed in 3D and the growth of angiogenic sprouts was characterized by multiple readouts, including total numbers of sprouts and nuclei, their intensities, volumes, and distances between objects. The number (or average) of nuclei per individual sprout can also be determined (Figure 5). Secondary analysis was completed using Microsoft Excel.
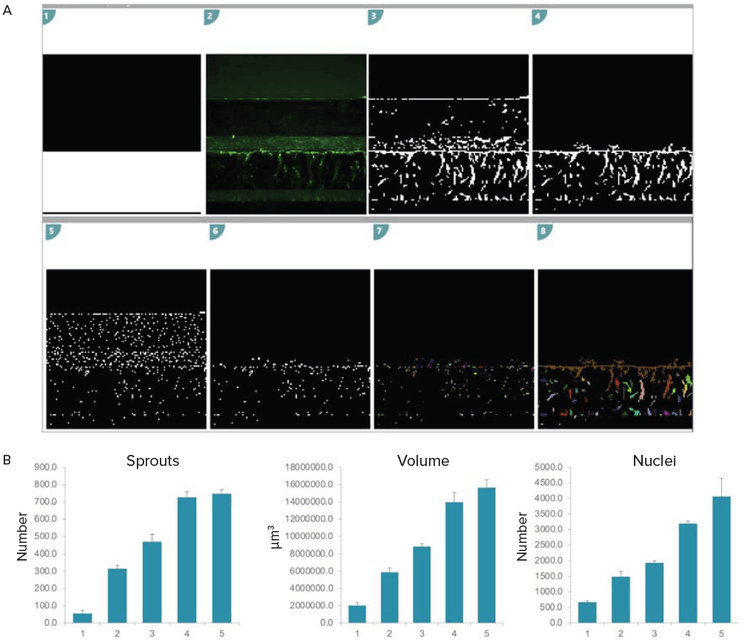
Figure 5. 3D analysis of angiogenic sprouts. A) Analysis set up in MetaXpress Custom Module editor (CME). Briefly, the analysis region which represents the ECM channel was created (white overlay). Image pre-processing was done to improve sprout segmentation. Only the sprouts within the analysis region were quantified (1–4). A similar set up was used to quantify nuclei (5–6). This segmentation was reiterated over all z-planes. The resulting segmentation masks were then joined to create volumetric measurements (7–8). B) Bar graphs representing quantitative growth of sprouts in 3D over time. The assay was performed in triplicates, error bars represent STDEV.
Conclusion
- We have developed an automated workflow for an OoC model of angiogenesis.
- Benefits of automation include the ability to increase assay throughput and improved data reproducibility.
- 3D imaging and analysis of angiogenic sprouts offers quantitative measures to describe complex biological processes.