
Application Note
Functional evaluation of neurotoxic and neuroactive compound effects in iPSC-derived 3D neural co-cultures
- Utilize a high-throughput 3D culture platform that more closely resembles the in vivo environment
- Characterize neuronal function and cytotoxicity assays
- Evaluate drug candidates and assess neurotoxicity using functional, structural, and terminal endpoints
Oksana Sirenko, PhD | Senior Applications Scientist | Molecular Devices
Carole Crittenden | Applications Scientist | Molecular Devices
Cassiano Carromeu, PhD | Lead Neuroscientist | StemoniX
Introduction
There is increasing interest in using more complex, biologically-relevant, and predictive cell-based platforms for assay development and compound screening. StemoniX® microBrain® 3D Assay Ready plates are a high-throughput 3D culture platform that more closely resembles the tissue development and constitution of native human cortical brain tissue. Each spheroid is comprised of a mixture of active cortical glutamatergic and GABAergic neurons co-matured with astrocytes from a single donor source. This balanced cellular mix allows the development of a neural network enriched in synapses, creating a highly functional neuronal circuitry. The neural cells in the microBrain 3D spheroids are physiologically active, with spontaneous, synchronized neuronal activity detectable as calcium oscillations.
Fast kinetic fluorescence imaging on the FLIPR® Tetra High-Throughput Screening System was used to measure the patterns and frequencies of calcium oscillations of neurospheroids as monitored by changes in intracellular calcium levels with a calcium-sensitive dye. A set of known neuromodulators was tested, including agonists and antagonists of NMDA, GABA, and AMPA receptors as well as kainic acid, analgesic, and antiepileptic drugs. Changes were observed as inhibitions or activations of the oscillation patterns and correlated to the expected effect of each neuromodulator.
We also tested a set of neurotoxic compounds including selected pesticides and flame retardants and demonstrated the sensitivity of the assay to the effects of compounds. The assay was optimized for high-throughput screening in 384-well plates and allowed for the characterization of oscillation profiles in neural spheroids by using multi-parametric analysis with ScreenWorks® Peak Pro™ Software. The automatically measured readouts included the oscillation rate, peak frequency, peak width, amplitude, and waveform irregularities.
The potential impact of compound treatment on cell viability and mitochondrial integrity was evaluated by high-content imaging using the ImageXpress® Micro Confocal High-Content Imaging System. EC50 values were determined for the impact of different compounds on Ca2+ oscillation rates or cell viabilities. Here, we demonstrate that functional and morphological assays using 3D neural spheroids formed with human iPSC-derived cells can be used for evaluation of drug candidates and neurotoxicity assessment using both calcium oscillation and high-content imaging.
Materials
- StemoniX microBrain 3D Assay Ready 384-well plates (StemoniX, cat. #BSARX-AA-0384)
- Sorvall ™ centrifuge
- FLIPR Calcium 6 Kit (Molecular Devices, cat. #R8190)
- Viability dye Calcein AM (Invitrogen, cat. #C3100MP)
- Mitochondria potential dye MitoTracker Orange (Invitrogen, cat. #M7510)
- Hoechst nuclear dye (Invitrogen, cat. #H3570)
- FLIPR Tetra System with ScreenWorks Peak Pro Software (Molecular Devices)
- ImageXpress Micro Confocal High-Content Imaging System with MetaXpress High-Content Image Acquisition and Analysis Software (Molecular Devices)
Utilize a more complex, biologically-relevant, and predictive cell-based platform
StemoniX microBrain 3D Assay Ready 384-Well plates were provided by StemoniX, Inc. The high-throughput 3D culture platform more closely resembles the tissue development and constitution of native human brain tissue. In this platform, human iPSC-derived neural spheroids, approx. 600 µM diameter, are composed of a physiologically-relevant co-culture of functionally active cortical glutamatergic and GABAergic neurons (identified by MAP2; green) and astrocytes (identified by GFAP; red) as seen in Figure 1. This balanced cellular mix allows the development of a neural network enriched in synapses, creating a highly functional neuronal circuitry. The neuronal cells in the microBrain 3D spheroids are physiologically active, with spontaneous, synchronized, readily detectable calcium oscillations. This advanced neural platform was optimized for high-throughput screening in 384-well plates and displays a highly consistent, functional performance across different wells and plates.
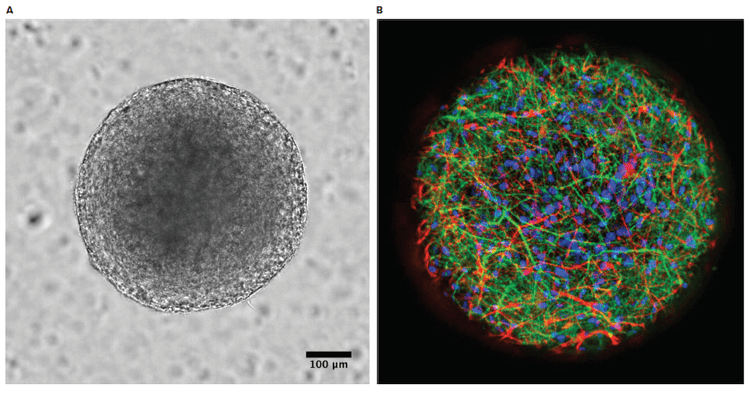
Figure 1. Brightfield and immunostained StemoniX microBrain 3D spheroids. A) Brightfield image. B) Immunostained spheroid showed active cortical glutamatergic and GABAergic neurons are identified by MAP2; green, astrocytes are identified by GFAP; red, and nuclei are identified by DAPI; blue. Images were acquired using the ImageXpress Micro Confocal system.
Methods
Set up 3D neural cultures
StemoniX microBrain plates were shipped pre-plated under ambient conditions. Each well contained a single, uniformly sized human iPSC-derived cortical neural spheroid matured 8-12 weeks. On the day of arrival, plates were centrifuged for 5 min at 200 x g, inspected by microscope to confirm spheroid settling to the bottom of the plate wells, decontaminated with 70% ethanol, and unsealed. Afterwards, the media was changed (1/2 of volume, three times), and plates were placed into a 37°C, 5% CO2 incubator for 5-7 days. Media changes were performed every second day.
A diagram of the workflow is shown in Figure 2. Wells were first imaged using transmitted light to verify the presence of spheroids. Next, the spheroids were incubated with FLIPR™ Calcium 6 dye, and calcium oscillations were imaged on the FLIPR Tetra System. Then, cells were further incubated with compound and stained for viability and analyzed on the ImageXpress Micro Confocal system.
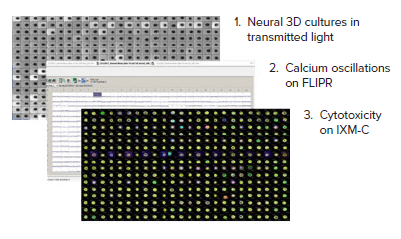
Figure 2. Multiparametric workflow utilizing 3D culture platform with kinetic and cellular imaging analysis. 1) StemoniX microBrain® 3D Assay Ready 384-Well plates were cultured and then viewed using transmitted light on the ImageXpress Micro Confocal system. 2) Spheroids were incubated with a calcium sensitive dye and neurotoxic compounds. When treated, changes in oscillation rates were analyzed on the FLIPR Tetra System. 3) Functional and viability screening was carried out on stained cells using the ImageXpress Micro Confocal system.
Assess early effects on calcium oscillations using a calcium flux assay
Intracellular Ca2+ flux in neurons was assessed using the FLIPR Calcium 6 kit as described in Sirenko, Grimm et al. 20171 . Kinetics of intracellular Ca2+-flux were determined at 515-575 nm following excitation at 470-495 nm for 10 minutes at a frequency of 8 Hz using the FLIPR Tetra System. The exposure time per read was 0.05s, the gain was set to 2000, and the excitation intensity was set to 30%. The instrument temperature was kept at a constant 37°C. Early effects on calcium oscillations were measured at 60 minutes following initial exposure to chemicals. For the early time points, cells were pre-loaded with FLIPR Calcium 6 dye for two hours prior to compound addition. Baseline for calcium oscillations without compounds was typically measured prior to compound addition. For 24-hour experiments, cells were exposed to chemicals at appropriate concentrations for 22 hours prior to the addition of FLIPR Calcium 6 dye. FLIPR Calcium 6 dye (4x concentration) was added for an additional two hours with extra volume of compounds to keep the compound concentration the same. For quantitative data evaluation, representative descriptors such as peak count (per 10 minutes), average peak amplitude, average peak width (at 10% amplitude), average peak spacing (time between peaks), average peak rise time (from 10% to 90% amplitude), and average peak decay time (from 90% to 10% amplitude) were derived using ScreenWorks software.
Stain live cells to assess phenotypic changes
Cells were stained live using three dyes: viability dye Calcein AM (1 µM), mitochondria potential dye MitoTracker Orange (0.2 µM), and Hoechst nuclear dye (2 µM). For assessment of neuro-specific markers, cells were fixed with 4% formaldehyde (Sigma) and stained with anti-MAP2 and anti-GFAP antibodies (BD Biosciences).
Evaluate neurotoxicity using high-throughput 3D imaging and analysis
Spheroids were imaged using the ImageXpress Micro Confocal system with a 10X Plan Fluor objective. The method and acquisition settings for spheroid assays were as previously described2. A z-stack of 19 images separated by 10-15 µM was acquired starting at the well bottom and moving up to cover a light-penetrable fraction of each spheroid (\~100-150 µM in depth). All individual images were saved and used for 3D analysis as well as 2D projection (Maximum Projection) analysis. The images were analyzed using the custom module editor in MetaXpress® High-Content Image Acquisition and Anlaysis Software. The analysis method was previously described in Sirenko, Mitlo et al. 20152. A customized analysis for additional multi-parametric outputs was generated using a protocol created in the MetaXpress custom module editor. First, the custom module analysis identified the spheroid. Second, the numbers of live cells were identified by the presence of Calcein AM signal. Third, the numbers of cells with intact mitochondria were detected by MitoTracker Orange staining. Dead cells were identified by an absence or decrease of Calcein AM signal. A similar approach can be used for 3D image analysis for evaluation of neurotoxicity and derivation of measurements in 3D, as previously described in Sirenko, Hancock et al. 20163 .
Results
Effects of neuromodulators on calcium oscillations
The neuronal cells in the microBrain 3D spheroids generate spontaneous, synchronized calcium oscillations. We used kinetic fluorescence imaging on the FLIPR Tetra System to measure the patterns and frequencies of the Ca2+ oscillations of neurospheroids as monitored by changes in intracellular Ca2+ levels with FLIPR Calcium 6 dye after a two hour incubation period. A set of known neuromodulators was tested, including agonists and antagonists of NMDA, GABA, and kainate receptors. Calcium oscillation frequency by the spheroids was measured over a 10 minute period after a one hour incubation with compound. Oscillation patterns from a subset of six compounds are shown in Figure 3A. Note the differences in the oscillation patterns when compared to the control. IC50 values and the mechanism of action of each compound are shown in Figure 3B.
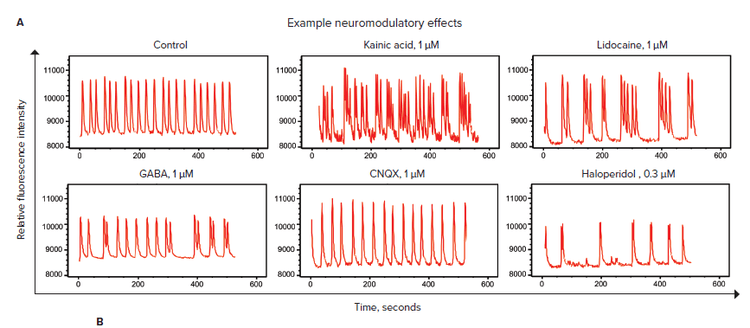
Figure 3. Evaluation of neuroactive compounds. A) Sample traces of calcium oscillations over a period of 10 minutes evaluated on the FLIPR Tetra System. Spheroids were treated with FLIPR Calcium 6 dye for two hours and with compounds for one hour. B) Mechanism of action and IC50 values were determined from a concentration response curve of the peak rates over a 10-minute period using a 4-parameter curve fit.
Evaluation of neurotoxicity effects
A number of industrial and environmental chemicals have reported neurotoxic effects in humans. The method described here can be used for screening compounds for potential neurotoxicity by evaluation changes in the calcium oscillation patterns and cell viability. For evaluation of neurotoxicity effects, the neurospheroids were incubated with several known neurotoxic compounds for 24 hours and then loaded with FLIPR Calcium 6 dye for two hours.
Calcium oscillations were measured on the FLIPR Tetra System. A subset of data is shown in Figure 4. Compared with the controls, the neurotoxic compounds caused perturbations of calcium oscillation patterns. Specifically, decreased peak frequencies or significantly smaller signal amplitude were observed for samples treated with indicated compounds.
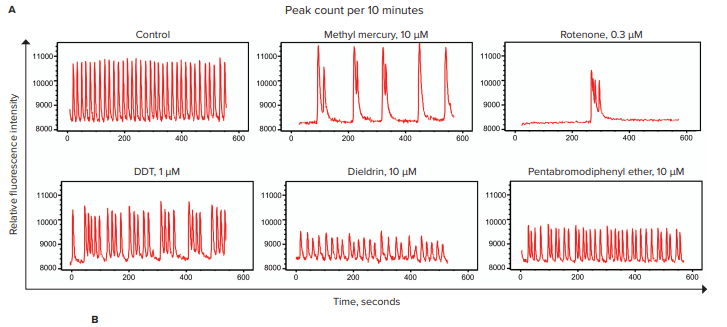
Figure 4. Evaluation of neurotoxicity effects of pesticides, an industrial compound, and a flame-retardant compound. A) Sample traces over a period of 10 minutes evaluated by the FLIPR Tetra system. A selected set of neurotoxic compounds were incubated with iPSC-derived microBrain neurospheroids for 22 hours. FLIPR Calcium 6 dye was incubated with the cells and compounds for an additional two hours. Calcium oscillations were recorded over 10 minutes. B) The table lists the chemical categories and the IC50 values, which were determined from a concentration response curve of the peak rates over a 10-minute period using a 4-parameter curve fit.
Evaluate cell viability and mitochondria integrity using high-content imaging
Confocal imaging and 3D image analysis methods were used to characterize compound effects on the morphology and viability of 3D neural spheroids. To evaluate cytotoxicity effects, cells were treated with various compounds for 24 hours and then live cells were stained with Hoechst nuclear stain, Calcein AM, and MitoTracker Orange dyes. Spheroids were then imaged using the ImageXpress Micro Confocal system with DAPI, FITC and TRITC channels and a 10X objective. Images of the control spheroid and spheroid treated with methyl mercury, an environmental toxin, are shown in the Figure 5. The analysis for imaging readouts was generated using the custom module editor in MetaXpress software. First, the analysis identified the spheroid. Second, the number of live cells were identified by the presence of Calcein AM signal. Third, the number of cells with intact mitochondria were detected by MitoTracker Orange staining. Dead cells were identified by absence or decrease of Calcein AM signal.
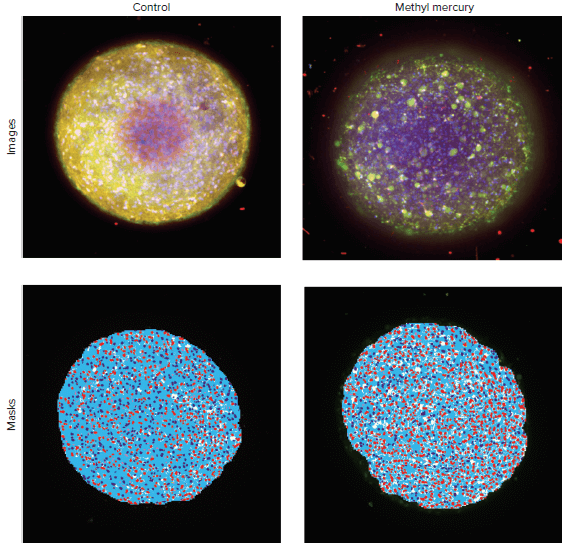
Figure 5. Maximum projection images for the control spheroid and a spheroid treated with 1 mM of methyl mercury. Nuclei shown in blue, calcein AM stain in green, and mitochondria stain in orange. Image analysis masks shown below the images included masks for spheroids (white), nuclei of cells positive for intact mitochondria stain (dark blue), nuclei of cells negative for mitochondria stain (red), and cytoplasm of positive cells (light blue). In the examples shown above, there were 608 positive cells (with intact mitochondria) in the untreated spheroids. In spheroid treated with methyl mercury, the number of positive cells decreased to 228.
Conclusion
In summary, we demonstrated that neurospheroids are responsive for evaluation of neurotoxic effects and can be used for evaluation of neurotoxicity effects of various compounds. We also demonstrated that the assay is amendable as a high-throughput assay format and for compound screening.
Multi-parametric analysis delivered informative readouts that enabled screening for effects of test compounds on neuronal activity as well as cell morphology and viability. Phenotypic descriptors used for neurotoxicity evaluation included calcium oscillation peak count, amplitude, spacing, and peak width, as well as the numbers of cells positive for Calcein AM or MitoTracker Orange. Effective concentrations of the compounds could be calculated for different readouts and then compounds could be ranked for their potential neurotoxicity hazard. The method was used to evaluate the toxicity effects of compounds from a library of compounds containing representative examples from different classes of chemicals, including pharmaceutical drugs, pesticides, flame retardants, and poly-aromatic hydrocarbons.
References
- Sirenko, O., Grimm, F. A., Ryan, K. R., Iwata, Y., Chiu, W. A., Parham, F., Wignall, J. A., Anson, B., Cromwell, E. F., Behl, M.,et al. (2017). In vitro cardiotoxicity assessment of environmental chemicals using an organotypic human induced pluripotent stem cell-derived model. Toxicol. Appl. Pharmacol. 322, 60–74.
- Sirenko, O., Mitlo, T., Hesley, J., Luke, S., Owens, W., and Cromwell, E. F. (2015). High-content assays for characterizing the viability and morphology of 3D cancer spheroid cultures. Assay Drug Dev. Technol. 13, 402–414.
- Sirenko, O., Hancock, M. K., Hesley, J., Dihui, H., Avrum, C., Jason, G., Carlson, C. B., and Mann, D. (2016). Phenotypic characterization of toxic compound effects on liver spheroids derived from iPSC using confocal imaging and three-dimensional image analysis. Assay Drug Dev. Technol. 14, 381–394.
For additional information, please refer to the following papers
- Sirenko, O., Parham, F., Dea, S., Carromeu, C., et.al (2018). Functional and Mechanistic Neurotoxicity Profiling Using Human iPSC-Derived Neural 3D Cultures. Toxicological Sciences 167(1).
- Anson, B. D., Kolaja, K. L., and Kamp, T. J. (2011). Opportunities for use of human iPS cells in predictive toxicology. Clin. Pharmacol. Ther. 89, 754–758.
- Camp, J. G., Badsha, F., Florio, M., Kanton, S., Gerber, T., WilschBräuninger, L. E., Sykes, A., Hevers, W., and Lancaster, M. (2015). Human cerebral organoids recapitulate gene expression programs of fetal neocortex development. Proc. Natl. Acad. Sci. U.S.A. 112, 15672–15677.