
Application Note
DNA and RNA absorbance measurements using SpectraMax Microplate Readers
- Direct quantitation of nucleic acids without standard curves
- DNA quantitation down to 250 ng/mL
- Preconfigured protocol with SoftMax Pro Software
Introduction
Ultraviolet (UV) measurements in microplates became possible when Molecular Devices introduced the first UV-capable microplate reader. Since then, microplate measurements of DNA, RNA, and proteins have become very popular. However, microplate assays require awareness of the optical properties of the microplate materials and more attention to technique than do traditional cuvettes in order to get accurate absorbance results, especially in the UV range. Lack of attention to these details is the most frequent cause of difficulty in adapting assays to microplates.
Absorbance measurements made through microplates are subject to pathlength variability and are vulnerable to interference from surface effects at the air/liquid interface. Modern microplate readers, with smaller optical beams than older wide-beam plate readers, are much more vulnerable to spurious readings due to dust. Particles in the light beam at the time of a read can cause artifactual absorbance spikes of up to 0.3 OD. Therefore it is especially important that sample solutions be free of particles. All of the above factors must be kept in mind in order to get accurate and reproducible absorbance results in microplates. Here, we provide guidelines for optimizing DNA/RNA absorbance measurements in SpectraMax® microplate readers.
Materials and methods
- SpectraMax microplate reader with UV absorbance detection (Molecular Devices)
- UV–transparent microplates
- Disposable: Corning cat. #3635 or Greiner cat. #655801
- Quartz: Hellma cat. #730.009-QG
Recommendations for best quality DNA absorbance values
- Use clean microplates and particle-free solutions. Filter buffers (e.g. pore size < 5 µm) to remove particulates and, for best results, do not re-use disposable microplates. Cover microplate if not read immediately.
- Note absorbance values of buffer blanks (include blanks at least in triplicate). If the blank values do not fall into the expected range, the most likely cause is a dirty microplate, particulates in the wells or a defective microplate. Plate background OD values of disposable UV microplates vary slightly between lots. You should determine the expected mean OD value by reading a clean water-filled plate from each new lot. Table 1 shows approximate OD260 and OD280 and standard deviation (SD) values for water-filled UV-transparent microplates. Corning UV and Greiner UV plates have background ODs almost as low as a quartz microplate.
- For low-absorbing samples use the maximum possible volume (250–300 µL) to get the maximum optical pathlength (and therefore maximum absorbance). Include duplicates or triplicates if possible. Automix the plate briefly to encourage symmetrical meniscus formation.
- If your procedure calls for a small sample volume (1–20 µL) plus a diluent, pipet the small volume into the well first, followed by the larger volume. Automix in the SpectraMax instrument for 10 to 20 seconds to complete the mixing. Results may be highly variable if the small sample is added last, due to incomplete mixing.
- Be aware that increasing ionic strength decreases absorptivity1,2. DNA has approximately 23% less absorbance when dissolved in TE-buffered saline rather than water (Figure 2). For highest sensitivity, DNA samples should be in deionized water.
Table 1. Optical densities of microplates at 260 nm and 280 nm. Values are averages from 5 clean plates, each filled with 200 µL water/well. *For Corning UV plates, mean values at 260 nm ranged from 0.046 to 0.057, depending on lot number.
Using PathCheck to normalize absorbance values to a 1-cm pathlength
SpectraMax readers are equipped with PathCheck Technology, which measures the pathlength in each well of a microplate and normalizes the absorbance values to a 1-cm pathlength so that they are the same as values obtained in a 1-cm cuvette.
ASample per cm = ASample / pathlengthSample (cm)
Before normalizing for pathlength, the OD of the microplate itself must be taken into account. The raw OD of a sample in a microplate is:
ODTotal = ASample + ABlank + ODmicroplate
Both ASample and ABlank are pathlengthdependent. The ODmicroplate is due to the OD of the microplate material and to reflectances from surfaces, and is pathlength-independent. Therefore, it must be subtracted first, before calculating pathlength-normalized absorbance values by the first equation shown above. SoftMax® Pro offers two options for subtracting ODmicroplate. Option 1 is recommended if sample volumes are variable. If all well volumes are identical, the ODmicroplate may be included in the ordinary reagent blank (Option 2).
Options for eliminating microplate OD in PathCheck calculations
Option 1: Use Plate Background OD
(Recommended for microplates with a low and uniform background.)
For each new lot of disposable UV microplates measure the ODmicroplate (“Plate Background OD”) at each wavelength intended to be used with PathCheck. Fill a clean plate with 100–200 µL water per well (volume is not critical because water does not absorb light appreciably between 190 and 900 nm) and read the plate. Do not use a dry plate because air has a different refractive index than water and thus gives a different OD value. The mean OD at a given wavelength is the Plate Background OD for that wavelength. ODmicroplate values at 260 nm and 280 nm should be similar to those shown in Table 1. If the SD is greater than 0.003 at 260 nm, you probably have a dirty or defective microplate.
When you have determined the Plate Background OD, enter it in the Data Reduction dialog box in SoftMax Pro. Designate locations of samples, standards and blanks in the Template Editor as usual and fill the microplate accordingly. When the plate is read, SoftMax Pro automatically:
- Subtracts the Plate Background OD from the raw well absorbance values.
- Applies PathCheck to all samples, standards and blanks (unless you have deselected it under Reduction*)
- Subtracts the reagent blank(s).
*If you de-select PathCheck, the plate background subtraction is also de-selected.
Option 2: Include ODmicroplate as part of the Plate Blank
Use this option when all well volumes (and pathlengths) are identical and all samples are blanked with the same solution.
By design, SoftMax Pro subtracts the plate blank (reagent blank(s)) after pathlength normalization. The ODmicroplate can be subtracted as a component of the plate blank if (and only if) all sample and blank volumes are identical.
Select three or more wells in the microplate to contain the blanking solution (typically water or buffer). In SoftMax Pro’s Template Editor assign those wells as “Plate Blank”**. Designate the remaining wells as samples and standards and prepare the plate accordingly. When the plate is read, SoftMax Pro automatically:
- Applies PathCheck to all samples and blanks (unless you have deselected it.)
- Subtracts the average of the Blanks from each well of the microplate. Provided that all sample and blank pathlengths are identical, potential error applying pathlength normalization to ODmicroplate is cancelled out
**SoftMax Pro subtracts the average absorbance value of the Plate Blank wells from each well of the microplate.
Example of DNA measurements in SpectraMax readers
Aliquots of calf thymus DNA (0.1–2.0 µg/mL in water) were read at 260 nm in a Corning UV microplate with PathCheck applied (Figure 1). The calculated limit of detection (amount producing an absorbance value higher than 3 positive SDs of the blank values above zero) was approximately 25 ng/well. The calculated limit of quantitation was approximately 75 ng/well, by using a very conservative criterion (amount producing an absorbance value higher than 10 positive SDs of the reagent blank above zero). In wells containing 300 µL, this limit translates 250 ng/mL. Lower limits can be achieved with a less conservative criterion, but require strict attention to technique. The results above were obtained with pre-diluted solutions under optimal conditions. If the protocol instead involves a small sacrificial DNA sample plus a diluent in each well, the limit of quantitation will be somewhat higher.
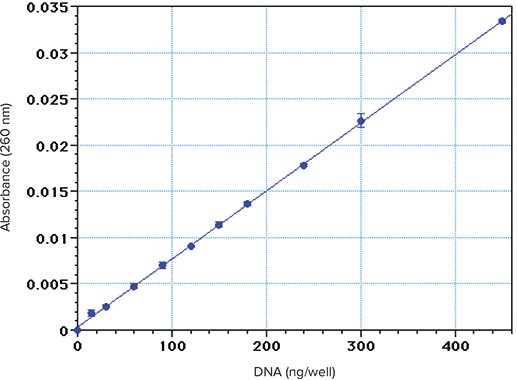
Figure 1. Standard curve obtained with calf thymus DNA dissolved in water. Triplicate 300 µL aliquots were placed in a Costar UV microplate and read at 260 nm with PathCheck applied.
The microplate results agree favorably with published limits of detection of DNA using A260 measurements in spectrophotometers3,4. This is not unexpected, in view of the high quality of UV-transparent microplates available and the fact that the optical pathlength in a full microplate well is approximately 1 cm. If the samples contain lower DNA concentrations, they cannot be measured by UV absorbance, and can only be measured with another technique, such as reaction with a fluorescent dye.
DNA/RNA estimation using absorptivity
DNA/RNA concentration is commonly estimated by dividing the A260 value by the 1-cm absorptivity value (or multiplying by its reciprocal). By using PathCheck, SpectraMax readers can automatically normalize sample absorbance values to a 1-cm pathlength and calculate the concentrations. The 1/absorptivity value for double stranded DNA at 260 nm is commonly assumed to be \~50 µg/mL for a 1-cm pathlength3,4. However, this value appears to be correct only when the solution has a relatively high salt concentration (Figure 2). DNA has 15% lower absorbance in TE buffer compared to water, and 23% lower absorbance in TE plus saline (TES). The calculated 1/ absorptivity values are 38, 45 and 50 µg/mL for DNA in water, TE and TES, respectively (Figure 2 inset).
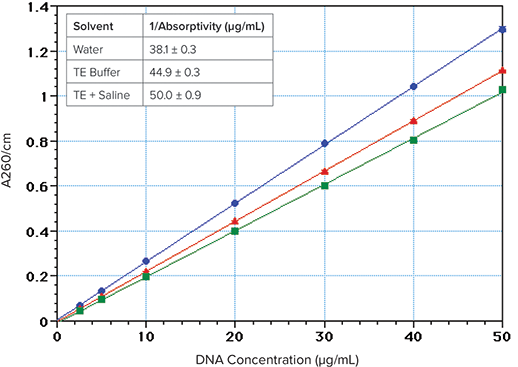
Figure 2. Effect of ionic strength on DNA absorption at 260 nm. The DNA (Sigma Type I “Highly polymerized”, Cat. No. 1501) was dissolved in deionized water (blue circles) or TE buffer (10 mM Tris, 1 mM EDTA, pH 7.4) (red triangles) or TES (TE buffer + 0.9% NaCl) (green squares). Inset: 1/absorptivity values; Average of 7 concentrations (2.5–50 µg/mL), 4 replicates each.
Using SoftMax Pro to calculate DNA concentration
DNA/RNA assay protocols often call for A260 measurements of small (2 - 10 µL) samples to which a diluent is added to get a workable sample volume. An example is the extraction of DNA from blood or tissue samples prior to sequencing or other assays. Before proceeding to the assay, the DNA concentration of a small sacrificial aliquot of the extract is determined and the result is used to calculate the aliquot size needed in order to transfer the desired amount of DNA to the assay. SoftMax Pro can automatically normalize A260 values from SpectraMax readers, determine the concentrations, and calculate the desired aliquot size. SoftMax Pro can also round off to the nearest 0.5 µL to accommodate liquid handling systems which are settable in 0.5 µL increments. Figure 3 gives an example of such a case, where the sacrificial aliquot was 5 µL and the target amount for the assay was 0.4 µg. The nominal aliquot volume was calculated for each sample and also that volume rounded off to the nearest 0.5 µL. These calculated results can easily be exported for use by external data handling systems.
D1
D2
0.125
0.126
E1
E2
0.074
0.071
F1
F2
0.120
0.140
G1
G2
0.048
0.050
H1
H2
0.142
0.149
*Aliquot size needed to transfer 400 ng
**Aliquot size rounded to nearest 0.5 µL
Figure 3. DNA extracts. Example of report generated by SoftMax Pro listing results for DNA extracts and the calculated aliquot volumes needed to contain a specified amount of DNA, for example to transfer to an assay.
Conclusion
With attention to technique, accurate and reproducible DNA/RNA measurements can be made easily in microplates. The lower limits of quantitation are comparable to those obtained in conventional UV-VIS spectrophotometers. Results can be normalized automatically to a 1-cm pathlength by using PathCheck to produce values equivalent to those obtained in a standard 1-cm pathlength cuvette. SoftMax Pro can calculate aliquot volumes needed to contain a specific amount of DNA/RNA, as well as report the results in customized formats. A preconfigured protocol for absorbance-based nucleic acid quantitation in SoftMax Pro facilitates data generation and analysis.
References
- Beaven, G.H., E.R. Holiday and E.A. Johnson. 1955. Optical properties of nucleic acids and their components, p. 493–553. The Nucleic Acids, Vol. 1. Academic Press, New York. (E. Chargaff and J.N. Davidson, Eds.)
- Wilfinger, W.W., K. Mackey and P. Chomczynski. 1997. Effect of pH and Ionic strength on the spectrophotometric assessment of nucleic acid purity. BioTechniques 22: 474–479.
- Sambrook, J., E. Fritsch and T. Maniatis. 1989. Molecular Cloning: A Laboratory Manual, 2nd ed. Cold Spring Harbor Laboratory Press, Cold Spring Harbor, New York. p. E.5.
- Gallagher, S.R. 1994. Quantitation of DNA and RNA with Absorption and Fluorescence Spectroscopy. Current Protocols In Molecular Biolgy, Vol. 3. John Wiley & Sons, pp. A3.D.1–A3.D3.