
Application Note
Detect GPCR activity with the cAMP-Gs HiRange HTRF assay
- Assured instrument performance with certified HTRF compatibility
- Highly robust, homogeneous assay for HTS
- Faster time to results with preconfigured SoftMax Pro Software protocols
Caroline Cardonnel | Sr. Applications Scientist | Molecular Devices
Introduction
HTRF® is a versatile technology developed by Cisbio for detecting biomolecular interactions. It combines fluorescence resonance energy transfer (FRET) technology with time-resolved (TR) measurement of fluorescence, allowing elimination of short-lived background fluorescence. The assay uses donor and acceptor fluorophores, which are used to label proteins or other biomolecules whose binding is to be studied. When the two biomolecules are bound to each other, the donor and acceptor are brought close together. Excitation of the donor by an energy source (e.g. a flash lamp) triggers an energy transfer to the acceptor, which in turn emits specific fluorescence at a given wavelength.
HTRF uses four specific fluorophores that can be combined to form compatible donor-acceptor TR-FRET pairs. The donors are europium cryptate (Eu3+) and terbium cryptate (Lumi4™-Tb), whose long-lived fluorescence enables their use in time-resolved fluorescence assays. Two acceptors have been developed for use in HTRF assays, XL665 and d2. Both have excitation spectra that overlap the emission spectrum of the HTRF donors with an emission peak at 665 nm that falls within a region where the donor does not emit significantly. The original HTRF acceptor, XL665, is a phycobiliprotein pigment purified from red algae. The second-generation acceptor, d2, is a modified allophycocyanin that is 100 times smaller than XL665 and was developed to alleviate steric hindrance problems that may occur with XL665-based assays.
The HTRF cAMP HiRange kit enables quantitation of cyclic AMP (cAMP, cyclic adenosine 3’, 5’–monophosphate) in cellular samples. cAMP is a key second messenger in G protein-coupled receptor (GPCR) signaling. Upon ligand binding to a GPCR, a conformational change occurs, activating the receptor and in turn activating a G protein. Further signal transduction depends on the type of G protein activated. Activation of Gsprotein leads to upregulation of cAMP by adenylate cyclase. Free cAMP produced by cells competes with d2-labeled cAMP for binding to the anti-cAMP cryptate, so an increase in cellular cAMP leads to a decrease in FRET, which is detectable as a decrease in the fluorescence emitted at 665 nm (Figure 1).
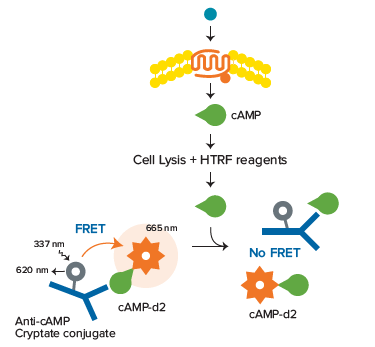
***Figure 1. cAMP assay principle.*Unlabeled cAMP produced by cells competes with d2-labeled cAMP for binding to anti-cAMP cryptate conjugate. Thus an increase in cellular cAMP leads to a decrease in FRET.
Here, we show how the SpectraMax® i3x and the SpectraMax® iD5 Multi-Mode Microplate Readers, both certified HTRF-compatible by Cisbio, are used to perform robust, no-wash assays for GPCR activity.
Materials
- cAMP G s HiRange kit (1000 tests, Cisbio cat. #62AM6PEB)
- White low-volume 384-well microplates (Greiner cat. #784075)
- SpectraMax i3x Multi-Mode Microplate Reader (Molecular Devices cat. #i3x)
- SpectraMax iD5 Multi-Mode Microplate Reader (Molecular Devices cat. #iD5)
- HTRF Detection Cartridge (Molecular Devices cat. #0200-7011) for the SpectraMax i3x reader
- HTRF Detection System (Molecular Devices cat. #6590-0144, includes Enhanced TRF module and HTRF filters) for the SpectraMax iD5 reader
Methods
The cAMP Gs HiRange kit was provided by Cisbio. cAMP standards with final concentrations ranging from 0.17 nM to 2800 nM were prepared as indicated in the kit package insert. A positive control without cAMP (maximum FRET) and a negative control without cAMP or cAMP-d2 were included. Reagents were dispensed to a final volume of 20 μL per well in a low-volume 384-well microplate as indicated in Table 1.
Table 1. Assay setup for a 384-well low-volume plate.
The plate was covered and incubated for one hour at room temperature. Time-resolved fluorescence was measured on the SpectraMax i3x and SpectraMax iD5 readers using preconfigured protocols in SoftMax® Pro Software (see Tables 2 and 3 for instrument-specific settings). Both Microplate Optimization and Read Height adjustment were performed on the SpectraMax i3x and the SpectraMax iD5 readers to ensure optimal assay sensitivity and dynamic range.
Excitation: 340 nm
Emission 1: 616 nm
Emission 2: 665 nm
Number of pulses: 30
Excitation time: 0.05 ms
Measurement delay: 0.03 ms
Integration time: 0.4 ms
Read height [optimize]
Table 2. Optimized instrument settings for the HTRF cAMP HiRange assay on the SpectraMax i3x reader.
Select ‘Use Filter’ for both Ex, Em.
Excitation: 340 nm
Emission 1: 616 nm
Emission 2: 665 nm
Number of pulses: 50
Excitation time: 0.05 ms
Measurement delay: 0.1 ms
Integration time: 0.6 ms
Read height [optimize]
***Table 3. Optimized instrument settings for the HTRF cAMP HiRange assay on the SpectraMax iD5 reader.*For HTRF reads, the Enhanced TRF module and excitation and emission filters contained in the HTRF Detection System must be installed.
Data analysis
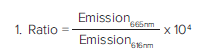
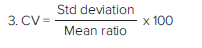
Analysis was performed using Cisbio’s patented ratiometric reduction method for HTRF assays, based on the two emission wavelengths detected. Analysis steps are shown below. Donor emission at 616 nm is used as an internal reference, while acceptor emission at 665 nm is used as an indicator of the biological reaction being assayed. This ratiometric measurement reduces well to-well variation and eliminates compound interference. Delta F, calculated in step 4 below, reflects signal to background of the assay and is useful for inter-assay comparisons. Results are calculated from the 665 nm/616 nm ratio and expressed in Delta F as follows:

(Rationeg=Ratio of negative control)
Data were generated and analyzed using SoftMax Pro Software, which contains several preconfigured HTRF protocols incorporating the steps above to simplify detection and analysis.
Results
Data were analyzed as described above and graphed with SoftMax Pro Software using a 4-parameter curve fit (Figure 2). Best results were obtained with the reader settings indicated in Table 2 (SpectraMax i3x reader) or Table 3 (SpectraMax iD5 reader). These settings were optimized in collaboration with Cisbio to certify the readers as HTRF compatible. Changing the delay time, integration time, or number of pulses may lead to less than optimal results. Assay suitability was assessed using the EC50and the signal-to-noise ratio, which should be ≤ 25 nM and ≥ 20, respectively, as indicated by Cisbio. EC50values were very similar for both readers and within acceptable range (Table 4). The signal-to-noise ratio was slightly improved for the SpectraMax iD5 reader, but both readers gave signal-to-noise ratios above the acceptable limits, with CV values below 6%. Both the SpectraMax i3x and the SpectraMax iD5 readers offer high sensitivity and a broad dynamic range for the cAMP GsHiRange assay.
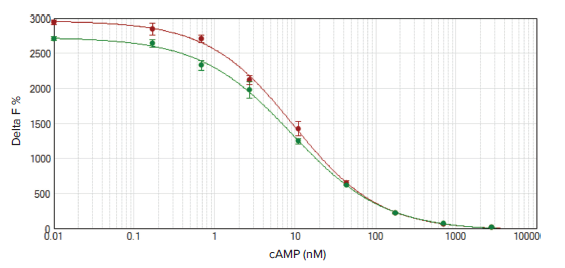
***Figure 2. HTRF cAMP calibration curves.*HTRF cAMP calibration curves were measured on the SpectraMax i3x (green circles) and SpectraMax iD5 (red circles) readers. The assay window for the SpectraMax iD5 was slightly larger, but the assay quality was excellent for both readers (CV values < 6%, R2=0.999).
EC
50
Table 4. Summary of results for the cAMP HiRange standard curve.
Conclusion
The SpectraMax i3x and SpectraMax iD5 readers can be equipped with an HTRF-certified detection cartridge (i3x) or an HTRF-certified module and filters (iD5) to meet the demanding specifications required for HTRF assays. Both readers demonstrated their ability to perform the cAMP GsHiRange assay with results well within Cisbio’s required range. Data acquisition and analysis are simplified using SoftMax Pro Software with preconfigured HTRF protocols.
Reference
Caroline Cardonnel | Sr. Applications Scientist | Molecular Devices
介绍
HTRF® 是由 Cisbio 开发的用于检测生物分子相互作用的通用 技术。它将荧光共振能量转移 (FRET) 技术与荧光的时间分辨 (TR) 测量相结合,可以消除短寿命的背景荧光。该测定使用 供体和受体荧光团,它们用于标记要研究其结合的蛋白质或其 他生物分子。 当两个生物分子相互结合时,供体和受体就靠 在一起了。能量源 ( 例如闪光灯 ) 对供体的激发触发能量转移 到受体,受体继而在给定波长发射特定荧光。
HTRF 使 用四种特定的荧光团,它们可以组合形成相容的供 体 - 受体 TR-FRET 对。 供体是穴状铕 (Eu3+) 和铽穴状化合物 (Lumi4 ™ -Tb),它们的长寿命荧光使其可用于时间分辨荧光 分析。已经开发了两种受体用于 HTRF 分析,XL665 和 d2。 两者的激发光谱都与 HTRF 供体的发射光谱重叠,在 665 nm 处的发射峰落在供体不显著发射的区域内。最初的 HTRF 受 体 XL665 是一种从红藻中纯化的藻胆蛋白色素。 第二代受体 d2 是改良的别藻蓝蛋白,比 XL665 小 100 倍,旨在缓解基于 XL665 的检测可能出现的空间位阻问题。
HTRF cAMP HiRange 试 剂 盒可 对 细 胞 样 品中 的 环腺 苷 酸 (cAMP,cyclic adenosine 3’, 5’–monophosphate) 进 行 定量。 cAMP 是 G 蛋白偶联受体 (GPCR) 信号传导中的关键 第二信使。配体与 GPCR 结合后,会发生构象变化,激活受 体,进而激活 G 蛋白。 进一步的信号转导取决于激活的 G 蛋 白的类型。 Gs 蛋白的活化导致腺苷酸环化酶对 cAMP 的上调。 细胞产生的游离 cAMP 与 d2 标记的 cAMP 竞争结合抗 cAMP 穴状化合物,因此细胞 cAMP 的增加导致 FRET 的减少,这可 以通过 665 nm 发射的荧光减少来检测 ( 图 1 )。
图 1 cAMP 检测原理。 细 细胞产生的未标记 cAMP 与 d2 标记的 cAMP 竞争结合抗 cAMP 穴状化合物偶联物。 因此,细胞 cAMP 的增加导致 FRET 的减少。
在这里,我们展示了如何用 SpectraMax® i3x 和 SpectraMax® iD5 多功能微孔板读板机 ( 均通过 Cisbio 的 HTRF 兼容性认 证 ) 对 GPCR 活性进行稳健、免洗的检测。
材料
- cAMP Gs HiRange 试剂盒 ( 1000 次测试,Cisbio cat.#62AM6PEB )
- 白色低体积 384 孔微孔板 (Greiner cat. #784075)
- SpectraMax i3x 多 功 能 微 孔 板 读 板 机 (Molecular Devices cat. #i3x)
- SpectraMax iD5 多功能微孔板读板机 (Molecular Devices cat. #iD5)
- 用于 SpectraMax i3x 多功能微孔板读板机的 HTRF 检测卡盒 (Molecular Devices cat. #0200-7011)
- 用于 SpectraMax iD5 多功能微孔板读板机的 HTRF 检测系统 ( Molecular Devices cat. #6590-0144,包括增强型 TRF 模 块和 HTRF 滤片 )
方法
cAMP Gs HiRange 试剂盒由 Cisbio 提供。 如试剂盒包装插 页所示,制备终浓度范围为 0.17 nM 至 2800 nM 的 cAMP 标 准品。包括不含 cAMP( 最大 FRET ) 的阳性对照和不含 cAMP 或 cAMP-d2 的阴性对照。 将试剂分配至低体积 384 孔微孔 板中,每孔终体积 20 µL,如表 1 所示。
表 1 384 孔低体积微孔板实验设置。
将 孔 板 在 室 温 下 加 盖 孵 育 一 小 时。 时 间 分 辨 荧 光 在 SpectraMax i3x 和 SpectraMax iD5 微孔 板 读 板机 上 使 用 SoftMax Pro 软件中的预设方法进行测量 ( 有关仪器特定设 置,请参见表 2 和表 3 )。在 SpectraMax i3x 和 SpectraMax iD5 读板机上进行了微孔板优化和读取高度调整,以确保最佳 的检测灵敏度和动态范围。
Excitation: 340 nm
Emission 1: 616 nm
Emission 2: 665 nm
Number of pulses: 30
Excitation time: 0.05 ms
Measurement delay: 0.03 ms
Integration time: 0.4 ms
Read height [optimize]
表 2 SpectraMax i3x 读板机上 HTRF cAMP HiRange 检测的仪器优化设置。
Select ‘Use Filter’ for both Ex, Em.
Excitation: 340 nm
Emission 1: 616 nm
Emission 2: 665 nm
Number of pulses: 50
Excitation time: 0.05 ms
Measurement delay: 0.1 ms
Integration time: 0.6 ms
Read height [optimize]
***表 3 SpectraMax iD5 读板机上 HTRF cAMP HiRange 检测的仪器优化设置。*对于 HTRF 读取,必须安装增强型 TRF 模块以及 HTRF 检测系统中包含 的激发和发射滤片。
数据分析
基于检测到的两个发射波长,HTRF 实验使用 Cisbio 专利的比 值算法进行分析,分析步骤如下所示。 供体在 616 nm 的发 射用作内参,受体在 665 nm 的发射用作所测定生物反应的指 示。 这种比率测量减少了孔与孔之间的差异并消除了化合物 干扰。 Delta F,在下面的步骤 4 中计算,反映了检测的信噪 比,可用于内部测定的比较。 结果由 665 nm/616 nm 比率计 算得出,并以 Delta F 表示如下:
(Rationeg=Ratio of negative control)
使用 SoftMax Pro 软件生成和分析数据,该软件包含多个预 设的 HTRF 方法,其中包含上述步骤以简化检测和分析。
实验结果
数据如上所述进行分析,并使用 SoftMax Pro 软件使用 4 参 数曲线拟合绘制图表 ( 图 2 )。使用表 2 ( SpectraMax i3x 读 板机 ) 或表 3 ( SpectraMax iD5 读板机 ) 中指示的读板机设置 获得了最佳结果。这些设置是与 Cisbio 合作优化的,以证明 读板机与 HTRF 兼容。 更改延迟时间、检测时间或脉冲数可 能会导致不太理想的结果。
图 2 HTRF cAMP 校准曲线。。SpectraMax i3x( 绿色圆圈 ) 和 SpectraMax iD5 ( 红色圆圈 ) 读板机上 HTRF cAMP 校准曲线测定。 SpectraMax iD5 的检 测窗口稍大,但两种读板机的检测质量都非常出色 ( CV 值 < 6%,R2=0.999 )。
EC
50
表 4 cAMP HiRange 标准曲线的结果总结。
结论
SpectraMax i3x 和 SpectraMax iD5 读板机可配备 HTRF 认证的检测卡盒 (i3x) 或 HTRF 认证的模块和滤片 (iD5),以满足 HTRF 检测所要求的苛刻参数。 两种读板机都证明了他们进行 cAMP Gs HiRange 检测的能力,结果完全在 Cisbio 要求的范围内。 数据 采集和分析可以通过使用带有预设 HTRF 方法的 SoftMax Pro 软件来进行简化。