
Application Note
Direct screening cytotoxic and antiproliferative activities of drug compounds on human leukemia U937 cell
- Assess live cell proliferation with a label-free, non-invasive imager
- Minimize cost by eliminating detection reagents
- Reduce error by removing sampling or pipetting steps needed for data collection
- Lower total assay time to under 90 seconds by eliminating assay detection reagent and incubation time
Shan Liu, PhD | Product Specialist | Molecular Devices
Rebecca Kreipke, PhD | Field Applications Scientist | Molecular Devices
Introduction
A fast, reliable and cost-effective high-throughput screening method for antiproliferation and toxicology evaluation in the early stage of drug discovery is highly attractive. The traditional methods to assess cell viability and proliferation utilize colorimetric readouts, such as the MTT assay1. Over time, “one solution” assays have been developed, based on MTS (5-(3-carboxymethoxyphenyl)- 2-(4,5-dimenthylthiazoly)-3-(4-sulfophenyl) tetrazolium), an analog to MTT which produces purple water-soluble formazans as cell viability indicators. Some “one solution” assays (Cell Cytotoxicity Assay- ab112118 ) use a proprietary water-soluble dye that changes its absorption spectra upon cellular reduction to achieve higher sensitivity and stability.
Although broadly used, absorbance-based colorimetric cell cytotoxicity assays have common limitations. They are sensitive to environmental conditions, such as incubation time and temperature, provide an endpoint-only readout, and, more importantly, they are destructive methods that rely on cell metabolism detection reagents. To screen large numbers of potential compounds in a large panel of cells, a fast, cost effective, and reliable system is desired and will greatly accelerate the pharmacology research.
The CloneSelect® Imager (CSI) expertly meets those challenges. It captures whole well images in a range of microwell plates with extremely fast data acquisition (90 seconds for the entire 96-well plate). Acquired data can then be either exported as an Excel spreadsheet for further analysis or displayed visually as a series of pie charts. With automated cell detection and well confluence determination algorithms, the CSI provides a label-free, non-invasive, and direct analysis of cell proliferation in each well in real-time and can monitor cell growth at multiple timepoints.
A workflow comparison between traditional colorimetric cell cytotoxicity assays and CSI image-based, label-free cell cytotoxicity assay (Figure 1) illustrates that the CSI assay reduces total assay time from 141 minutes to less than two minutes by eliminating assay detection reagent use and incubation time. In addition, the present study demonstrates the use of the CSI in cytotoxic and antiproliferative activity evaluation of anticancer drugs. Human monocytic U937 cell line, a robust cellular model2 the high-throughput screening was used in the cytotoxicity assessment of three anticancer drugs: 5-Fluorouracil (5-Fu)3, Cisplatin, and Oxaliplatin4. Our results show that the CloneSelect Imager offers a rapid, reliable, and lowcost alternative in determining the cytotoxicity of different anticancer drugs on human non-adherent leukemia cell line U937.
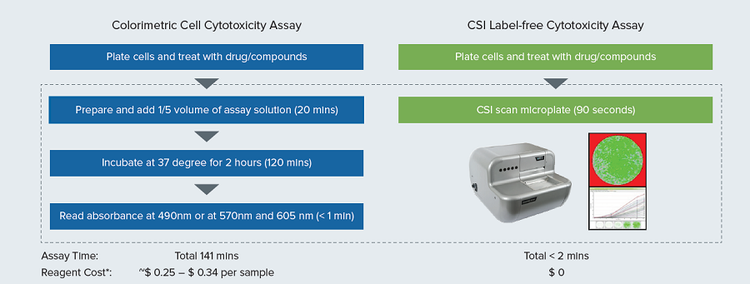
Figure 1. Workflow comparison of traditional colorimetric absorbance-based Cell Cytotoxicity Assay and Clone Select Imager (CSI) image-based label-free Cell Cytotoxicity Assay. *Estimated reagent cost per sample is calculated by the price of Assay kit #1 and Assay kit #2 used in this study.
Materials and methods
Materials used
- Assay kit #1: CellTiter 96® AQueous One Solution Cell Proliferation Assay (Promega cat. #G3580)
- Assay kit #2: Cell Cytotoxicity Assay Kit (Abcam cat. #ab112118)
- Human monocytic U937 cell line (ATCC cat. #CRL-1593.2)
- 5-Fluorouracil (Millipore Sigma cat. #F6627)
- Cisplatin (Millipore Sigma cat. #232120)
- Oxaliplatin (Millipore Sigma cat. #O9512)
- Corning 96-well microplates (Corning cat. #3300)
Cell plating prior to the assay
To validate the capability of each assay to accurately detect a wide range of viable cells, U937 cells were plated at 312 to 10,000 cells per well in Corning 96-well microplates. The first column of each plate contained medium only (no cells) and was set as the blank control for use in data analysis. Untreated cells were allowed to settle and grow at 37°C, 5% CO2 for 24h prior to the assay.
Cell proliferation/cytotoxicity assay
U937 cells were seeded in Corning 96-well microplates at a density of 5,000 cells/well and allowed to grow at 37°C, 5% CO2 for 24h. 100–150 μL of cell culture water was added to the space between wells to help minimize the media evaporation and ensure even heat distribution among wells and regions. Next day, the plates were first monitored with the CloneSelect Imager to generate day0 well confluence data, followed by an addition of different compounds in triplicate wells at concentrations from 256.2 μM to 0.039 μM for 5-Fluorouracil, or from 167 μM to 8.47 nM for Cisplatin and Oxaliplatin, in a threefold dilution series. Microplates with non-treated cells (controls) and treated cells were repeatedly measured by CSI at different time points (day1, day2) to monitor cell growth, and returned to the incubator. On day3, to obtain the cytotoxicity data from the same plate at the same time point, the same microplate was first scanned using the imager and subsequently 30 μL of a “one solution” from Assay kit #1 or Assay kit #2 was added to each well, and the plate was kept at 37°C for two hours. Using the SpectraMax® ABS Plus Microplate Reader, the absorbance (optical density, OD) was read at 490 nm for Assay kit #1 and read at ratio of 570 nm/605 nm for Assay kit #2.
Statistical analysis
All data obtained with CloneSelect Imager assay or with colorimetric assays were background corrected by subtracting the values of the no-cell control wells (background) from those of the wells containing cells. The effect of drug treatment on cells was calculated using the following equation: cell viability (%) = 100X sample/ control. To estimate the drug effect measured with the CSI assay, well confluence has been analyzed to calculate relative cell viability using the non-treated cells (control) as 100% viable cells at the end of the assay: relative cell viability (%) = 100X sample/control. The EC50 values were determined by SoftMax® Pro 7.1 Software (Molecular Devices) using the non-linear regression 4-parameter logistic curve fit. EC50 is the drug concentration that produces 50% of the maximum cell response.
Results
The results from the CSI assay and colorimetric assay are directly comparable as the same wells with different cell densities were assayed with the colorimetric kits immediately after being imaged by the CloneSelect Imager. In Figure 2, data were plotted as backgroundcorrected values of absorbance (assay kit) or well confluence (CSI assay) versus cell numbers per well. Both CSI assay and colorimetric assays can readily measure cell densities from 10,000 to as few as 312 cells per well in a 96-well plate.
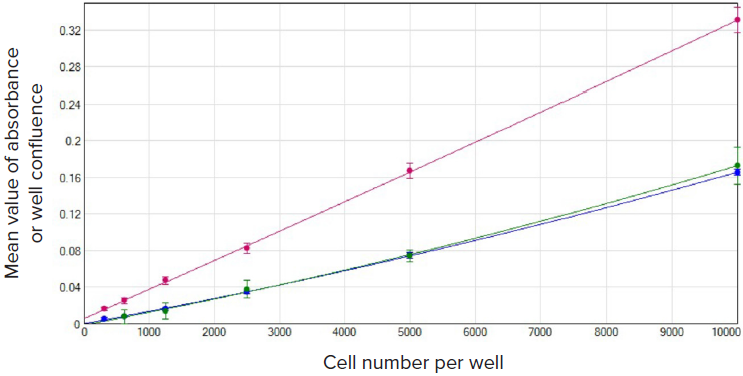
Figure 2. Detection comparison of a wide range of untreated U937 cells 24h after seeding. Mean value of absorbance (assay kits) or well confluence (CSI system) vs. cell number per well was graphed using the quadratic curve fit in SoftMax Pro Software. Red plot, assay kit #1, (r2 = 1.000); blue plot, assay kit #2 (r2 = 1.000); green plot, CSI assay (r2 = 0.999).
Figure 3 has shown the dose-response curves of incubation of the drug (5-FU) with U937 cells for 72 hours in nine different concentrations. The dose-response curve of CSI assay (green plot) was in line with those of another two colorimetric cytotoxicity assays (Assay kit #1 & #2). All data were plotted using the dose-response 4-parameter curve fit in SoftMax Pro Software. Similar EC50 values of 2.2 μM (blue plot, Assay kit #2), 3.0 μM (green plot, CSI assay), and 4.7 μM (red plot, Assay kit #1), respectively, were calculated by the software.
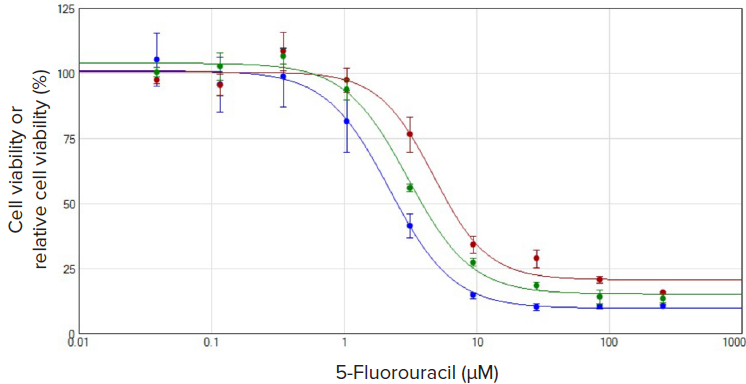
Figure 3. Comparison of the dose-response plot of U937 cells treated with 5-Fluorouracil for 72 h. All plots display cell viability or relative cell viability normalized by non-treated cells vs. compound concentrations. Data are plotted using the dose-response 4-parameter curve fit in SoftMax Pro Software. Red plot, assay kit #1; blue plot, assay kit #2; green plot, CSI assay.
Another two platinum-based anticancer drug Cisplatin and Oxaliplatin have been tested in the same manner as 5-Fluorouracil. In Figure 4, the CSI provided an intuitive heat map with pie chart and values revealing the different cytotoxic activities displayed by both platinum drugs after incubation with the cells for 72 hours. The cells treated with the same concentrations of Cisplatin and Oxaliplatin have shown that Oxaliplatin is more cytotoxic than Cisplatin in the U927 cells, which is in line with the findings in other carcinoma cell lines4. This result was also confirmed by two colorimetric assays (Assay kit #1 and Assay kit #2) conducted on the same samples right after the CSI assay (Table 1), showing Oxaliplatin has a lower EC50 value which indicates higher cytotoxicity. The EC50 values of the three anticancer drug compounds obtained by CSI assay are within 1–2 micromolar range to those obtained by traditional colorimetric cell cytotoxicity assays.
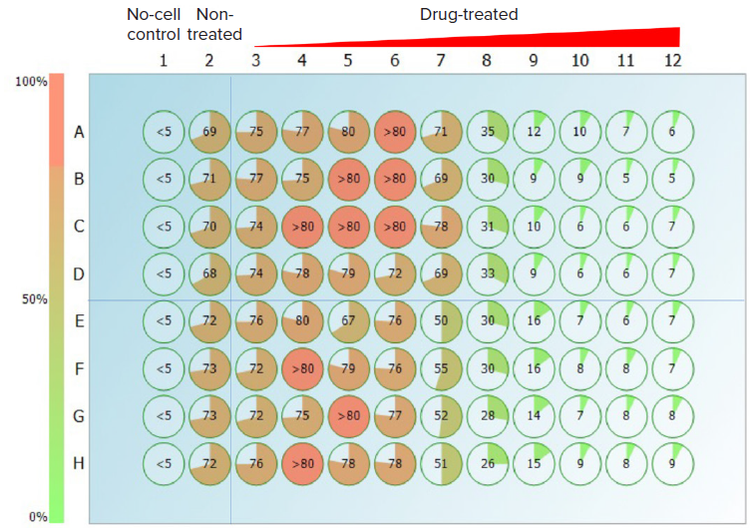
Figure 4. Percentages of well confluence of the U937 cells treated with Cisplatin (rows from A to D), or Oxaliplatin (rows from E to H) for 72h. The compound concentration is increasing from column 3 to column 12 (from left to right: 8.47 nM, 25.4 nM, 76.2 nM, 0.229 μM, 0.686 μM, 2.06 μM, 6.17 μM, 18.5 μM, 55.6 μM, and 167 μM).
Table 1. EC50 (μM) values obtained after 72 h incubation with three anticancer drug compounds using non-adherent U937 cells.
Conclusion
In this study, CloneSelect Imager assay has been compared with two widely used colorimetric absorbancebased cell cytotoxicity assays in quantifying the cytotoxic effects of three anticancer drug compounds on U937 cells. All three assays generated very similar EC50 results. However, the CSI assay offers a label-free direct assessment of drug effects on cells in less than two minutes with zero reagent cost, zero incubation time and zero hands-on time for sample handling by using instant whole-well cell imaging and well confluence determination to obtain these preliminary data. Additionally, the CSI assay allows users to collect data repeatedly at multiple time points without sampling or any intervention with the drug treatment or ongoing functional assays. This labelfree, non-invasive nature saves users time and costs during early stage new compound screening and drug development. All those features make the CloneSelect Imager an attractive alternative to traditional colorimetric cell cytotoxicity assays in drug screening and in pharmacology research.
References
- Mosmann T: Rapid Colorimetric Assay For Cellular Growth And Survival- Application To Proliferation And Cyto-Toxicity Assays. J Immunol Methods 1983, 65(1–2):55–63.
- Liu G, Chen S, Hu A, et al. The Establishment and Validation of the Human U937 Cell Line as a Cellular Model to Screen Immunomodulatory Agents Regulating Cytokine Release Induced by Influenza Virus Infection. Virol Sin. 2019 Dec;34(6):648–661.
- Ghoshal, K., and Jacob, S. T., An alternative molecular mechanism of action of 5-fluorouracil, a potent anticancer drug. Biochem. Pharmacol., 53(11), 1569–1575 (1997).
- Marqués-Gallego, P., den Dulk, H., Backendorf, C. et al. Accurate non-invasive image-based cytotoxicity assays for cultured cells. BMC Biotechnol 10, 43 (2010).